
A survey of 45 GEO papers: what holds up and what doesn't
Reading a critical survey of three years of generative engine optimization
A survey of 45 GEO papers: four research shifts in three years, nine stages of AI visibility, why content-only optimization cuts citations, and what reproduces. This survey reorganizes 45 GEO papers from 2023–2026 into a causal visibility pipeline that runs from activation to retrieval, citation, absorption, and behavior.
This survey brings together 45 GEO papers from 2023–2026 and critically sorts out what reproduces in controlled experiments and what falls apart under competition and measurement. Three years after the original GEO paper first defined generative engine optimization, the paper count has grown into the dozens, but the conclusions have been all over the place [1][2]. The survey's core message is simple. Making already-retrieved content more prominent inside the answer has been causally confirmed, but no technique has yet been found that reliably affects retrieval itself or clicks and conversions, across multiple platforms, over time [1].
If you have worked on GEO in practice even once, this confusion will feel familiar. In one benchmark, citing sources lifts visibility by as much as 41%, while in another experiment the same tactic actually lowers ranking [1][2]. The survey resolves this contradiction not by asking "who is wrong" but by asking "which stage of the pipeline does each technique touch."
Three years, four shifts in the question
The survey organizes the history of GEO research into four shifts. It started with "can a source gain visibility," moved quickly to "can rankings and recommendations be manipulated," then went through "do heuristics generalize under competition," and has now arrived at "how do we measure the whole pipeline" [1].
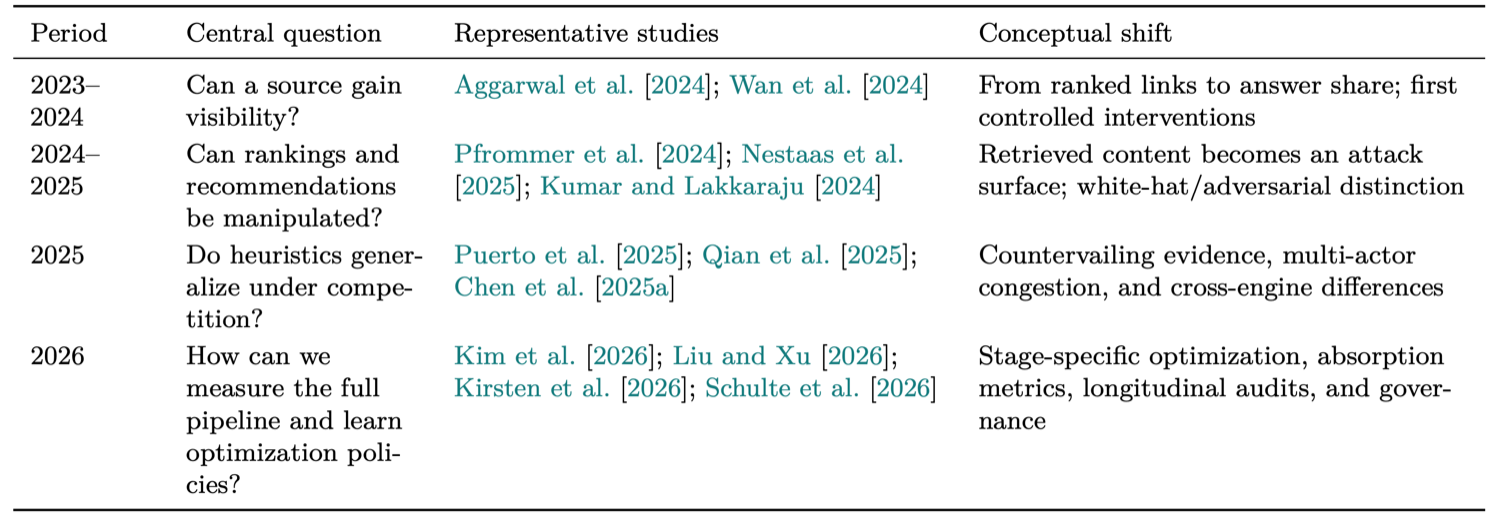
Table 1. The four periods of GEO research, with the central question and conceptual shift of each [1].
This arc matters because, over time, research has widened its view from "how do we edit the words" to "how does the whole system move." The early optimism ("+41%") and the recent skepticism ("zero-sum under competition") look like they conflict, but they were actually measuring different stages [1].
Visibility has nine layers
The backbone of the survey is the causal visibility pipeline. Before a source is cited in an answer, it has to pass several gates. The generative surface is triggered (activation), the page is crawled and indexed, retrieved as a candidate, reranked into the context, generated and cited, actually absorbed into the answer, and finally leads to attention, clicks, and conversions.
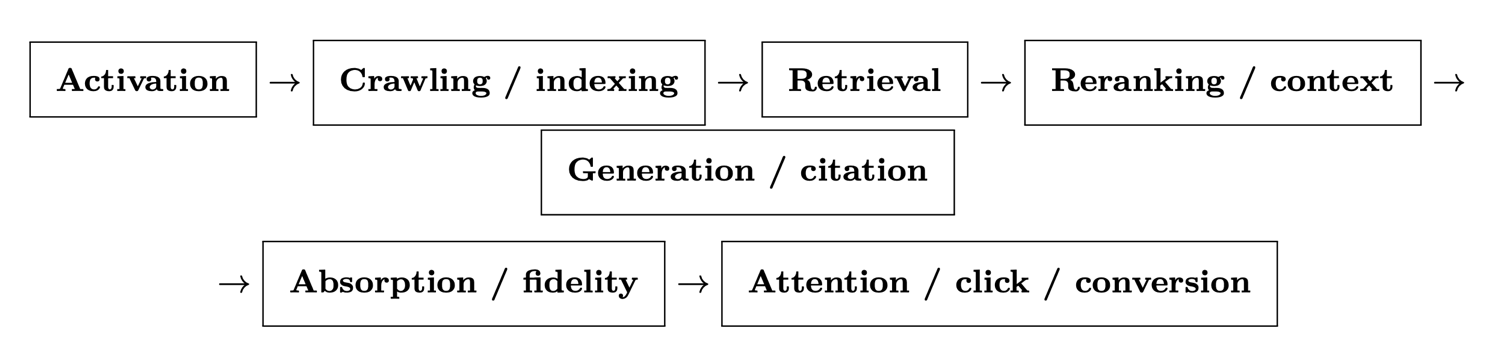
Figure 1. The causal visibility pipeline. Most GEO research optimizes only the stages between context placement and citation, and observes crawling, retrieval, and user behavior far less [1].
The problem is that most studies look only at one or two middle stages of this chain, namely the stretch where a source already in the context gets cited. So the single word "visibility" actually refers to nine different quantities. The survey lays them out from easiest to observe to closest to user value [1].
| Stage | Example metric | What it tells you | What it can't tell you |
|---|---|---|---|
| Activation | Pr(activation) | Probability a generative answer or search is triggered | Visibility of a specific source |
| Retrieval | recall@k, domain presence | Candidate pool, discoverability in the context | Citation or influence in the response |
| Mention | Brand or entity appearance | Minimal nominal visibility | Tone, source, evidence, clicks |
| Citation | Citation rate, first-citation rank | Explicitly selected as a source | Exact evidence, real contribution |
| Prominence | Word count, PAWC, repetition | Observed volume and position | Human attention without validation |
| Coverage | Share of sub-questions answered | Breadth of the information need | Causal effect on the sentences |
| Absorption | Ablation with and without the source | Factual, linguistic, structural contribution | Model internals when using proxies |
| Fidelity | Citation recall and precision | Alignment between claim and source | Positive visibility or economic effect |
| Behavior | Clicks, conversions, revenue | Observed downstream outcomes | Causality without a control group |
Table 2. A nine-stage taxonomy of visibility metrics. Each stage answers a different question and needs a different denominator [1].
The lesson of this table is that it is hard to talk about results with a single "citation rate" line on a dashboard. Citation guarantees neither credibility nor evidence, and absorption, fidelity, and behavior after it are separate layers [1][4].
The two sturdiest levers
Across all 45 papers, two factors were the most reproducible: query-document topical relevance and position within the context [1].
Start with relevance. The ConflictingQA experiment used counterfactual interventions to show that models prefer "explicit alignment that directly answers the question" more strongly than human trust cues such as scientific sources or a neutral tone [1]. Position is just as powerful. One study found that moving a source higher in the context had a bigger effect than most sentence rewrites, and a factorial experiment with 252,000 trials, 6 LLMs, and 18 factors identified relevance and position as the primary determinants of the first citation [1]. In a sense, the data confirms an obvious conclusion: even a perfectly polished page contributes nothing if it is not in the top-k.
Next comes extractable evidence. Statistics, definitions, comparisons, prices, dates, and sources form "units" that a generator can easily pick out and attribute. The original paper and FeatGEO also observed positive effects from these attributes [2][3]. The survey grades the main white hat levers by strength of support.
| Lever | Strength of support | Conditions |
|---|---|---|
| Query-document relevance | Strong in controlled settings | Clear intent, no manipulation |
| Position in context | Strong | Source already retrieved |
| Extractable evidence | Moderate to strong | Compatible with truthfulness, attribution, intent |
| Freshness, price, date | Moderate | Time-sensitive and commerce queries |
| Document structure | Moderate and heterogeneous | Effect direction differs by stage |
| Fluency, simplification | Weak to moderate | Depends on domain and engine |
| Authoritative tone | Weak and unstable | Can conflict with credibility |
| Keyword stuffing | Ineffective or negative | Multiple benchmarks recommend avoiding it |
Table 3. Empirical support for the main white hat levers [1].
Reproducibility drops as you go down the table. Authoritative tone in particular is unstable because it can make confidence look like evidence, and keyword stuffing was ineffective or even lowered visibility across several benchmarks. The original paper's conclusion, that evidence and position create citations more than surface wording does, is reconfirmed at the scale of 45 papers [1][2].
The generalization wall
If that was the good news, the survey's real contribution is that it honestly gathers the bad news. It identifies three reasons why tactics that work in benchmarks fall apart in practice [1].
First, fixed recipes don't generalize. Across two tasks, six domains, about 1,900 queries, and 16,360 documents, C-SEO Bench found only 3 of 54 method-domain combinations significantly positive, and none in the question answering task [1][4]. In e-commerce, too, 10 of 15 early heuristics were neutral or negative [1].
Second, competition eats the gains. As adoption rises, individual gains shrink and eventually converge to near zero-sum congestion dynamics [1]. Because one actor's optimization changes another actor's outcome, an effect measured alone in a lab disappears the moment everyone copies it.
Third, retrieval and citation trade off. This is the key to the "+41% vs. -30%" contradiction above. SAGEO Arena put retrieval and reranking back in and remeasured on 171,003 documents and 2,700 queries. Optimizing only the content cut average top-20 visibility by about 9%, top-10 visibility after reranking by 16%, and final citations by 6% [1]. A rewrite that gets cited well once inside the context actually lowers the chance of getting into that context (retrievability). Fixed-context benchmarks measure only the direct effect at the generation stage, and when you measure the whole pipeline, the sign flips.
Measurement is unstable
Finally, the survey warns about the instability of measurement itself. Even when the same query is repeated at temperature 0, 9–28% of decisions change, and even within 24 hours source-level Jaccard stays at just 0.34–0.42 [1]. Differences between engines are even larger. Of the domains cited by Google AI Overviews, 53% were not in the organic top 10 and 27% were not even in the top 100. URL Jaccard between organic Google, AIO, and Gemini was low, at 0.11–0.18 [1]. There is no such thing as a global GEO ranking, so any metric needs to state the product, search mode, and time period alongside it.
Activation probability also depends heavily on query form. One audit observed an overall AIO activation rate of 13.7% across 55,393 trending queries over 40 days, and 64.7% for question-form queries [1]. Being cited does not guarantee trustworthiness either. In a fidelity audit on par with the original work, only 51.5% of verifiable sentences were fully supported and only 74.5% of citations accurately supported their claim, and a 2026 follow-up classified about 11% of 98,020 atomic claims as insufficiently grounded [1][4]. A citation is a signal of selection, not proof of accuracy.
The TRAIL view: measure first, recommend conditionally
The implications of this survey for our work are clear. Results in AEO and GEO come down to "did the AI cite us when it built its answer, and how much of that answer did we take up," and TRAIL Search tracks that citation and share of voice (SoV) by engine. Put into practice, the survey's lessons look like this.
- Don't speak in one number: visibility has nine stages, so look at activation, retrieval, citation, and prominence separately, along with the engine and time period. A single citation-rate line can't tell you about absorption or fidelity.
- Start with what's solid: first take care of topical relevance that directly answers real information needs, and structure that rises in retrieval and reranking. These are the two most reproducible axes.
- Make the evidence real: include extractable evidence such as statistics, sources, and definitions, within the bounds of truthfulness. Surface tone or keyword repetition backfires.
- Watch competition and upstream together: even well-edited content has a negative net effect if it gets retrieved less. You need an audit that measures retrievability and citation together.
In the end, this survey returns GEO to being neither optimism nor cynicism but a "measurement problem." Before declaring what works, first state which stage of the pipeline you are measuring. Place FeatGEO, which designs citations automatically, and RAG source attribution, which traces which documents built an answer, on this map, and each line of research finds its place in the pipeline [1][3].
You can continue with SAGEO Arena: edit only the body and you drop out of search.
Frequently asked questions
What works most reliably across three years of GEO research?
Query-document topical relevance and position within the context. In controlled experiments, these two were the most reproducible drivers of the first citation. A factorial experiment with 252,000 trials also found relevance and position to be the primary determinants, and moving a source higher in the context had a bigger effect than most sentence rewrites.
Do tactics like adding statistics or sources not work?
They work conditionally. Extractable evidence (statistics, definitions, comparisons, sources) has moderate to strong support as long as it respects truthfulness and attribution constraints. But it is not a cure-all: the direction changes by domain, engine, and pipeline stage, so a fixed recipe does not generalize.
Why do tactics that work in benchmarks fall apart in practice?
Competition and trade-offs. When everyone uses the same tactic, the gain disappears and approaches zero-sum (in C-SEO Bench, only 3 of 54 combinations were significantly positive). And editing only the content makes a document get cited well once it is in the context, but retrieved less often upstream, so final citations fell by as much as 6%.
So can GEO be measured?
There is no single stable metric yet. Even at temperature 0, 9–28% of decisions change across repeats, and the overlap of cited domains across engines is low, at a Jaccard of 0.11–0.18. That is why the survey splits visibility into nine stages from activation to behavior and recommends measuring with the engine, search mode, and time period stated explicitly.
References
- [1]"Optimizing Visibility in Generative Engines: A Critical Survey of Generative Engine Optimization (2023–2026)", arXiv 2026
- [2]Aggarwal et al., "GEO: Generative Engine Optimization", KDD 2024
- [3]Liu & Xu, "Think Before Writing: Feature-Level Multi-Objective Optimization for Generative Citation Visibility", ACL 2026
- [4]Liu et al., "Evaluating Verifiability in Generative Search Engines", EMNLP Findings 2023
Summary
- This survey reorganizes 45 GEO papers from 2023–2026 into a causal visibility pipeline that runs from activation to retrieval, citation, absorption, and behavior.
- The research question shifted four times in three years: from gaining visibility, to manipulability, to generalization under competition, and finally to measuring the whole pipeline.
- The sturdiest levers were topical relevance and position in the context, followed by extractable evidence such as statistics and sources. Keyword stuffing is ineffective or counterproductive.
- Generalization is weak. Only 3 of 54 method-domain combinations were significantly positive, and optimizing only the content means being retrieved less often, cutting final citations by as much as 6%.
- Reproducibility is also a problem. Even at temperature 0, 9–28% of decisions change, and no technique with a stable, cross-platform causal effect has been found yet.
Check this topic against your own brand
TRAIL Search measures how ChatGPT and Perplexity answer your customers' questions and finds and fixes where the brand is missing, turning this post into a diagnosis. Start with 10 questions, no card required.
More posts
Cutting LLM agent costs: delegate decisions to a 4B model
Cutting LLM agent costs: delegating choices to a small decision model saved 81 to 89 percent, but only with thresholds fitted on the agent's own runs.

How to build a small LLM: Sheared-LLaMA's 3% compute path
How to build a small LLM, what LLM pruning is, whether small models are enough for AI agents, and the cost of building one, read through Sheared-LLaMA.

The world model that teaches a robot from video: V-JEPA 2
Whether you can teach a robot from video alone, what an AI world model is, and how it differs from a video generator, read through Meta's V-JEPA 2 paper.
Keep reading on this topic
- Does AI search use your exact question? 70,000 queries showHow AI search turns a question into queries, why uncited pages are not irrelevant, and what retrievers miss, from Perplexity's Q2D-Web benchmark paper.
- Is agent memory better than RAG over the raw conversation?A 2026 UIUC study of why agent memory systems trail RAG over raw history, what LLM summaries lose, and how a path back to the source cuts the loss.
- Why RAG misses the evidence an answer needsA 2026 MBZUAI study of why RAG retrieves only part of the evidence multi-fact questions need and how chunking erases document identity.
This post is part of the Papers category, which collects all 36 posts on the topic. See all posts in Papers