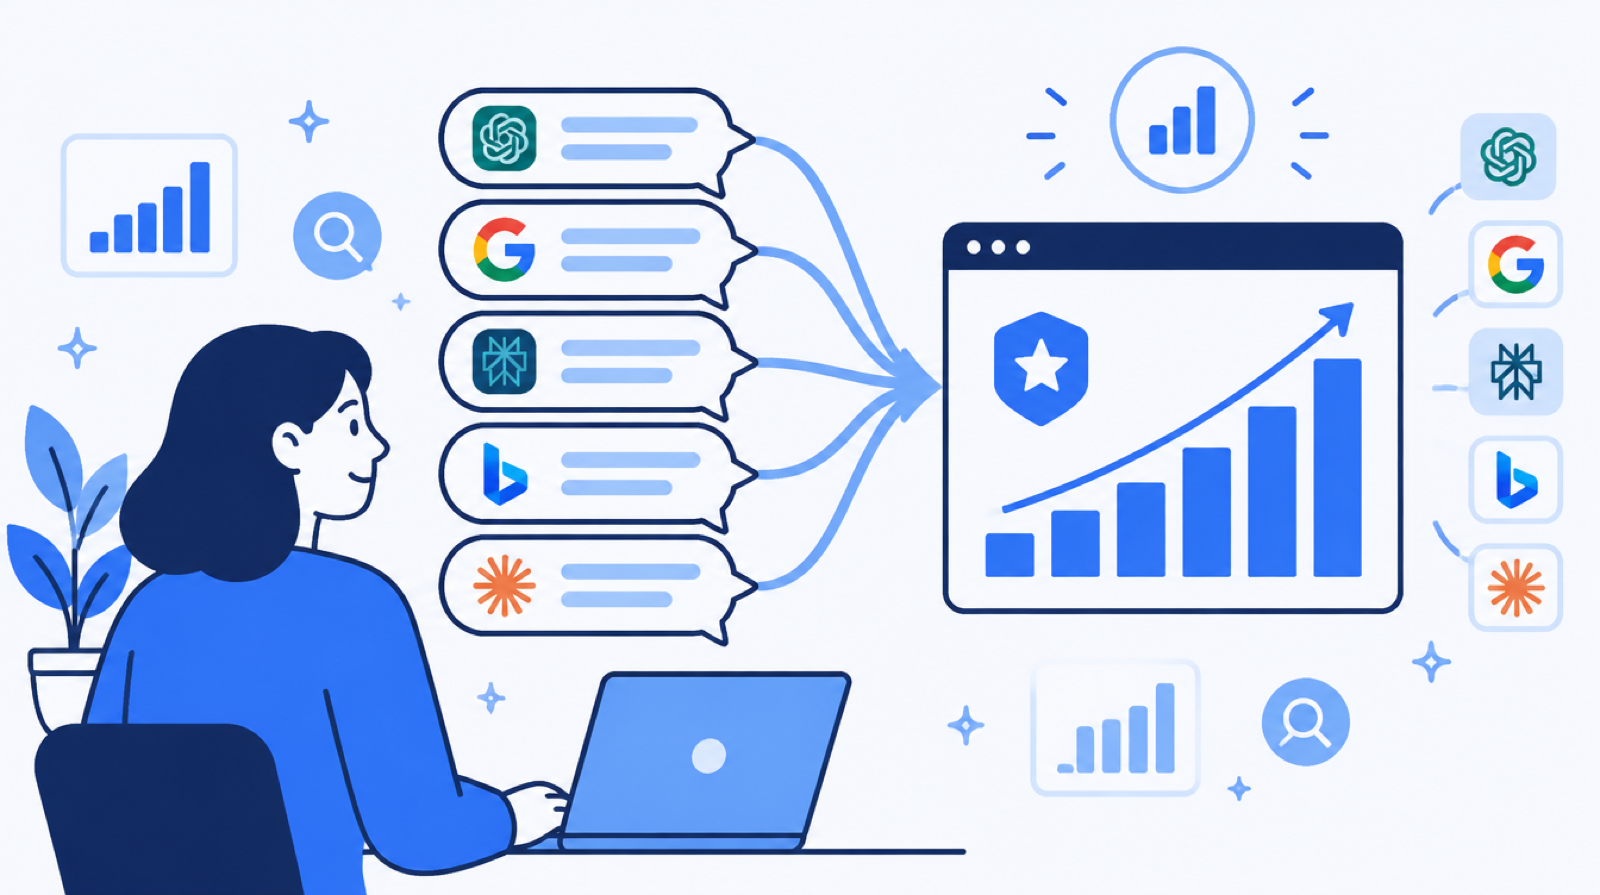
Which Brands Do AI Search Engines Mention? A Benchmark
A brand visibility map of five AI engines, measured across 100,000 responses
A large-scale GEO benchmark of brand visibility across five AI engines: how size and awareness matter, how engines differ, and where citations come from. This paper is the first benchmark to measure brand visibility at scale, collecting 102 brands, 102,025 responses, and 150,000 citations across five AI engines.
This paper is the first GEO benchmark to measure, at scale, whether AI actually mentions a brand when a user asks about its category, observing 102 brands across five AI search engines more than 100,000 times. It tracks ChatGPT, Gemini, Perplexity, Claude, and Grok from March to May 2026, defines brand visibility, and puts numbers on how the engines differ [1]. We covered the definition and metrics of the GEO problem in the original GEO paper, so here we dig into the large-scale measurement built on top of it and what it found.
Search used to mean scanning ten blue links. Now people ask AI directly. For brands, the question has changed too. It used to be "where do we rank for this keyword?" Now it is "when someone asks about our category, does AI say our name?" [1][2]. This paper builds a ruler for that question and actually applies it to 102 brands.
What it measures: three signals of visibility
In this paper, brand visibility is not a single number but a bundle of three signals [1].
- Mention: does the brand appear in the response (Boolean)?
- Position: if it appears, in what order was it named (1st, 2nd, 3rd)?
- Sentiment: was it framed in a positive, neutral, or negative tone?
There is one more important distinction. Visibility in unbranded queries that do not include the brand name ("best Indian fintech payment platform") measures real discoverability, while visibility in branded queries that do include the name ("what does Razorpay do") only confirms existing awareness [1]. The paper's headline is always unbranded visibility, because the outcome that matters is whether AI already knows to name you.
Each response gets a mention type . These stand for first recommendation (fr), top 3 (t3), mention (m), indirect (i), and no mention (none) [1].
How the five engines are measured
Start with the setup of the five engines being measured. Search grounding policies differ from engine to engine, and that difference explains much of the results that follow [1].
| Engine | Model | Web search policy |
|---|---|---|
| ChatGPT | GPT-5 | Weekly cooldown per brand |
| Gemini | Gemini-3 | Always grounded |
| Perplexity | Sonar | Always grounded (search-native) |
| Claude | Claude Sonnet | Weekly cooldown per brand |
| Grok | Grok-3 | Always searches |
Table 1. Models and web search policies of the five engines [1].
Visibility is the share of prompts in which the brand is mentioned. It is defined as the fraction of the prompt set where a mention occurs [1].
Average position is the mean position across only the prompts where the brand is mentioned. Lower is better [1].
Share of Voice divides a brand's mention count by the sum of its own mentions and those of qualified competitors. The competitor set in the denominator, , includes only domains that recur or actually exist, so hallucinated names invented by an engine do not inflate the denominator [1].
The sentiment score gives 1 to positive, 0.5 to neutral, and 0 to negative, scaled to 100. One negative mention costs twice as many points as one neutral mention [1].
How differently engines cite sources is measured by the Jaccard overlap of their cited domain sets. is the set of domains engine cited for prompt [1].
Here is the scale of the data: 102 brands, 3,508 completed tracking runs, 102,025 prompt responses, about 15,815 brand mentions, and 149,912 source citations, collected from March to May 2026 [1]. Confidence intervals use 10,000 bootstrap resamples, and tier comparisons use Kruskal-Wallis followed by Bonferroni-corrected Mann-Whitney tests [1].
Brand prominence dominates visibility
The paper's headline is the prominence ladder. Split brands into three tiers and measure unbranded visibility on the first tracking run, and visibility drops sharply with each step down [1].
| Tier | Example brands | Unbranded visibility | 95% CI | Gap to next tier |
|---|---|---|---|---|
| Tier 1 () | Stripe- or Nike-level | 72.9% | [60.1, 84.2] | −29.3 pts |
| Tier 2 () | Mid-size and regional leaders | 43.6% | [36.4, 50.9] | −32.2 pts |
| Tier 3 () | Niche and small | 11.4% | [4.2, 20.3] | None |
Table 2. First-run unbranded visibility by prominence tier [1].
The statistics strongly support this ladder. Kruskal-Wallis gives , , rejecting the hypothesis that the three tiers share the same distribution, and every pairwise comparison survived Bonferroni correction [1]. The effect size, Cohen's , was a huge 2.34 for T1 versus T3 [1]. In the paper's words, "each step down the prominence ladder costs about 30 percentage points of unbranded visibility" [1].
This matters because most brands sit in Tier 3, and they appear in only about 11% of category queries [1]. The dominant extreme of discoverability is invisibility.
Engines give different answers
Even for the same brand, visibility varies a lot by engine and by the type of question. First, here is the first-run recognition rate split into branded and unbranded [1].
| Engine | Branded | Unbranded |
|---|---|---|
| ChatGPT | 94.2% | 22.1% |
| Gemini | 94.0% | 18.7% |
| Perplexity | 98.5% | 23.9% |
| Claude | 100.0% | 51.5% |
| Grok | 100.0% | 12.0% |
Table 3. First-run recognition rate by engine (branded vs. unbranded) [1].
It is no surprise the branded column is above 90%. You ask with the name, so the engine recognizes it. The real signal is the unbranded column, and apart from Claude (51.5%), most engines cluster in the 12–24% range [1]. Claude's higher number is partly because this cohort is skewed toward high-prominence brands [1].
The type of question is also decisive. Broad discovery questions surface brands well, but specific problem or use-case questions barely surface them at all [1].
| Prompt category | Overall | ChatGPT | Gemini | Perplexity |
|---|---|---|---|---|
| Discovery | 22.9% | 22.0% | 20.6% | 20.0% |
| Problem/Solution | 10.8% | 10.4% | 8.9% | 9.1% |
| Use Case | 11.4% | 9.9% | 11.9% | 10.3% |
| Comparison | 74.6% | 73.3% | 72.6% | 73.7% |
| Brand Research | 97.0% | 97.9% | 95.7% | 95.7% |
Table 4. Unbranded visibility by prompt category (excerpt) [1].
Brands show up most in broad "best X" questions at 22.9%, and least in specific problem and use-case questions at 10.8–11.4% [1]. Engines also look at different sources. In the CRM case, the average source overlap across platform pairs was a Jaccard of about 0.12, which is very low [1]. A tactic that works on one engine does not transfer well to another.
Zoom into one category and you see a steep position gradient. In a reference study that tracked ten CRM brands, the average position when mentioned looked like this [1].
| Brand | ChatGPT | Gemini | Perplexity | Claude | Grok |
|---|---|---|---|---|---|
| Salesforce | 1.2 | 1.3 | 1.4 | 1.8 | 2.1 |
| HubSpot | 1.5 | 2.0 | 1.8 | 1.3 | 1.9 |
| Zoho | 3.1 | 3.8 | 3.5 | 2.4 | 3.2 |
| Pipedrive | 3.4 | 3.6 | 2.8 | 3.1 | 4.1 |
Table 5. Average position by brand and engine in the CRM reference study (lower is better) [1]. The top three brands took 51% of all CRM mentions [1].
Citations do not come from your own domain
The paper also dissected, at scale, which sources create visibility. Split the 149,912 citations by source class and the picture is clear [1].
| Source class | Citations | Share |
|---|---|---|
| Company and third-party brand pages | 112,763 | 75.2% |
| YouTube and video | 6,311 | 4.2% |
| Tech and business media | 5,666 | 3.8% |
| Reddit and community forums | 4,992 | 3.3% |
| Academic, government, social, and developer | 4,617 | 3.1% |
| Brand's own domain | 4,392 | 2.9% |
| Wikipedia and reference | 3,882 | 2.6% |
| Software reviews (G2, Capterra) | 1,604 | 1.1% |
Table 6. Citation distribution by source class [1].
The key point: a brand's own domain accounts for only 2.9% of citations, while 75.2% point to pages from other companies in the same field [1]. No matter how much you polish your own pages, most citations come from competitor and neutral pages. The Matthew effect that Algaba et al. observed, where "already-cited domains get cited more," shows up at the brand level too [4]. So share of voice (SoV) becomes a contest fought on competitors' pages.
Looking only at content pages, the lever is clear. Listicles (ranking lists like "best CRM tools") make up 21% of all citations, so one well-ranked list carries you into many AI answers [1]. This lines up with the C-SEO Bench conclusion that source-side signals are what need work [3].
Mentions are stable, sentiment swings
Repeat the same brand, prompt, and engine cell over many runs, and mentions turn out to be surprisingly deterministic. Of unbranded cells observed three or more times, 63.2% never appear and 14.3% always appear. Only 6.8% are "flipping," wavering between 30% and 70% [1]. In other words, 77.5% are near-binary, splitting into always or never [1].
Sentiment is the opposite. On the same basis, the sentiment flipping rate is 45.5%, about 6.7 times noisier than mention flipping (6.8%) [1]. On the other hand, cells locked into always negative were 0.0%. Negative sentiment shows up but does not stick, and engines practically never fixed a tracked brand as negative [1]. In practice, this means you need 10 or more prompts per brand to stabilize a sentiment score [1].
What happens if you leave things alone? In the no-intervention baseline, the per-run slope of unbranded visibility was mostly flat, but ChatGPT (−1.34%/run) and Perplexity (−0.76%/run) alone showed a statistically significant gradual decline [1]. "If you do nothing, visibility slowly leaks on these two engines" [1].
Limits of this benchmark
The paper draws its own boundaries clearly [1].
- Observational, not causal: all tracking trajectories are observational baselines, and whether recommendations actually raise visibility is deferred to an RCT (Protocol P3). Applying Aggarwal et al.'s experimental design to a fleet of brands is the follow-up work [1][2].
- Convenience-sample cohort: the cohort skews toward SaaS, retail, fintech, and Indian DTC, so it is not representative of categories. Tier 1 is small at , which leave-one-out sensitivity (70.5–76.7%) helps with but does not fully resolve [1].
- Hand-coded tier assignment: people assigned tiers based on wiki, press, and funding signals, so subjectivity creeps in. An inter-rater reliability audit is deferred to v1.1 [1].
- Platform opacity: inferences come only from API outputs. The engines' collection and retrieval internals cannot be observed directly [1].
- Heuristic sentiment: the 45.5% flipping rate mixes output variance with classifier noise [1].
The TRAIL view: multi-engine visibility is a tracking problem
The question this study raises is exactly the problem we work on every day. AEO and GEO outcomes come down to "when AI built this answer, did it name us, in what position, and in what tone?" That multi-engine visibility and share of voice (SoV) tracking is exactly what TRAIL Search does. Translated into working principles, the paper's findings look like this.
- Measure each engine separately: source overlap is low at about 0.12 [1], so if you merge five engines into one dashboard and look only at the average, the real gaps disappear. The sources that surface in ChatGPT and the ones that surface in Perplexity are different pages.
- Look beyond your own pages: only 2.9% of citations point to your own domain [1], so share on competitor, review, and listicle pages is the real battleground. In particular, whether you appear in listicles, which account for 21% of all citations, is a big lever [1].
- Know your prominence before you start: tiers are about 30 points apart [1], so for small brands it is more realistic to target SoV against competitors than head-to-head recognition.
- Run on a 14–30 day cycle: mentions are near-binary and stable, but sentiment swings 6.7 times more [1], and left alone, visibility slowly declines on some engines [1]. Remeasure every 2–4 weeks rather than quarterly, and check the effect of each intervention.
In the end, this paper moves GEO from "gut feel" to "measurement." If FeatGEO, which solves what to include through design, is optimization on the content side, this study is the ruler that measures, at scale, how that optimization changes your place inside real AI answers. Read it alongside the RAG source attribution research, which traces which documents produced an answer, and design and measurement fit together as a pair. If you don't measure, you can't fix.
You can continue with Can AI recommendations be manipulated?.
Frequently asked questions
What does this paper mean by 'brand visibility'?
Whether AI actually mentions, cites, or recommends a brand when a user asks a category question. It is measured through three signals: whether the brand is mentioned (Boolean), its position when mentioned (1st, 2nd, 3rd), and positive, neutral, or negative sentiment. Visibility in unbranded queries, where the brand name is not included, is the core metric for real discoverability.
Do results differ a lot from engine to engine?
Yes. For the same query, engines cite domains that barely overlap. In the CRM case, the average source overlap (Jaccard) across platform pairs was about 0.12, which is very low. Visibility by prompt category also varies by engine, so a single playbook for all five engines does not work.
If we build a great website, will we get cited?
Your own domain is not enough. Only 2.9% of all citations pointed to a brand's own domain, while 75.2% pointed to pages from other companies in the same field. Listicles such as 'best X tools' are the biggest lever at 21% of all citations, so one ranking list can carry you into many AI answers.
Is there no way forward for a small brand?
The prominence ladder is harsh. Tier 1 scored 72.9%, Tier 2 43.6%, and Tier 3 11.4%, dropping about 30 points per step. But mentions are near-binary, splitting into always or never, and left alone they slowly decline in ChatGPT and Perplexity. The realistic approach is to target share of voice (SoV) on competitor pages and remeasure every 14–30 days.
References
- [1]Kumar, "Generative Engine Optimization at Scale: Measuring Brand Visibility Across AI Search Engines", arXiv 2026
- [2]Aggarwal et al., "GEO: Generative Engine Optimization", KDD 2024
- [3]Puerto et al., "C-SEO Bench: Does Conversational SEO Work?", NeurIPS Datasets 2025
- [4]Algaba et al., "How Deep Do Large Language Models Internalize Scientific Literature and Citation Practices?", 2025
- [5]Yang, "News Source Citing Patterns in AI Search Systems", 2025
Summary
- This paper is the first benchmark to measure brand visibility at scale, collecting 102 brands, 102,025 responses, and 150,000 citations across five AI engines.
- Visibility is measured through three signals (mention, position, sentiment), with separate formulas for visibility, average position, share of voice (SoV), sentiment, and source overlap.
- The headline is the prominence ladder: unbranded visibility for Tiers 1, 2, and 3 was 72.9%, 43.6%, and 11.4%, dropping about 30 points per step.
- Engines diverge. Source overlap is low at about 0.12, only 2.9% of citations point to a brand's own domain, and listicles are the biggest lever at 21% of all citations.
- Mentions are near-binary and stable, but sentiment swings 6.7 times more. Measure each engine separately, and remeasure every 14–30 days rather than quarterly.
Check this topic against your own brand
TRAIL Search measures how ChatGPT and Perplexity answer your customers' questions and finds and fixes where the brand is missing, turning this post into a diagnosis. Start with 10 questions, no card required.
More posts
Cutting LLM agent costs: delegate decisions to a 4B model
Cutting LLM agent costs: delegating choices to a small decision model saved 81 to 89 percent, but only with thresholds fitted on the agent's own runs.
How to build a small LLM: Sheared-LLaMA's 3% compute path
How to build a small LLM, what LLM pruning is, whether small models are enough for AI agents, and the cost of building one, read through Sheared-LLaMA.
The world model that teaches a robot from video: V-JEPA 2
Whether you can teach a robot from video alone, what an AI world model is, and how it differs from a video generator, read through Meta's V-JEPA 2 paper.
Keep reading on this topic
- Does AI search use your exact question? 70,000 queries showHow AI search turns a question into queries, why uncited pages are not irrelevant, and what retrievers miss, from Perplexity's Q2D-Web benchmark paper.
- Is agent memory better than RAG over the raw conversation?A 2026 UIUC study of why agent memory systems trail RAG over raw history, what LLM summaries lose, and how a path back to the source cuts the loss.
- Why RAG misses the evidence an answer needsA 2026 MBZUAI study of why RAG retrieves only part of the evidence multi-fact questions need and how chunking erases document identity.
This post is part of the Papers category, which collects all 36 posts on the topic. See all posts in Papers