Measuring AI search: GSC, GA4, prompt tracking routines
If you read traffic reports and AI mention reports separately, you only see half the results
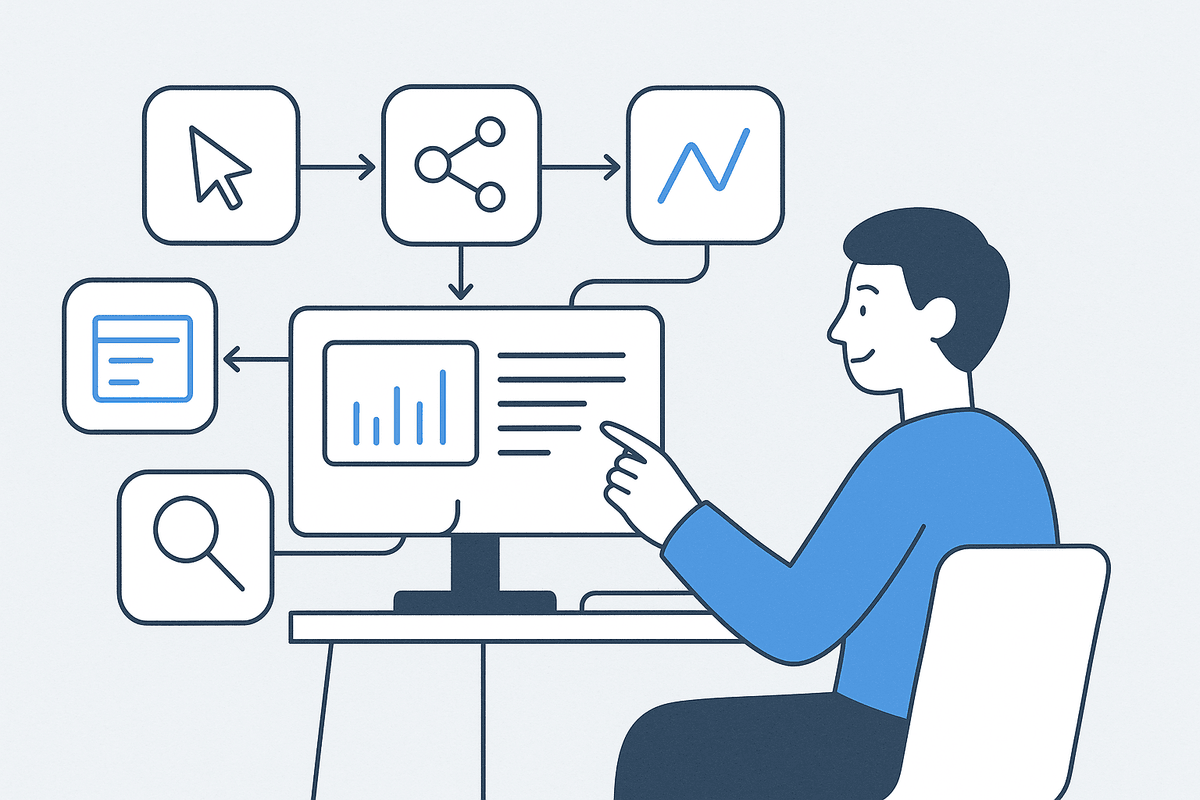
AI search results only make sense when you connect five axes. Weekly and monthly routines, which report comes first, and what axes belong on your dashboard.
You cannot measure AI search performance properly by reading traffic reports and AI mention reports separately. You need to capture baseline search data with GSC, confirm real visits and conversions with GA4, see the question moments with prompt tracking, and connect it all to what actually produced the result with page contribution. Read separately, each of these leaves you with only half a picture.
Why measurement has gotten harder
When search results were mostly lists of links, interpreting performance was relatively simple. Impressions, clicks, sessions, and conversions followed almost a straight line. In AI search, though, users read the answer first and then decide whether to click. In some cases they remember the brand without clicking and come back through another channel.
When Google introduced its AI search experience, it also made the point that quality should not be judged by click counts alone[1]. Because AI compresses the context and shows it up front, there may be fewer clicks than before but more intentional visits.
This is where practitioners often fall into a trap. They conclude that AI search performance has worsened the moment GSC clicks drop, or they assume the few LLM referrals in GA4 represent all of AI search, or they collect a few screenshots of brand mentions and call it a performance report. All three are half-picture interpretations.
The trap is especially dangerous in practice because a half-picture reading often leads to the opposite conclusion. For example, some teams see GSC clicks fall, conclude that "AI search is costing us," and cut the budget. But if direct return visits and brand searches in GA4 rose over the same period, those may actually be users who saw an AI answer, remembered the brand, and came looking for it later. Deciding budget on a single metric leads you to cut a channel that is actually working.
Each of the five axes answers a different question
Treat AI search performance not as a single tool but as a bundle of data that answers different questions.
| Axis | Main data | Core question |
|---|---|---|
| GSC | Queries, impressions, clicks, CTR | Which search demand and pages responded on the search results page |
| GA4 | Session source, landing page, engaged sessions, conversions | Did real visits and conversions happen |
| Prompt tracking | Appearance by question set, answer context | Which questions do we appear in and drop out of |
| Brand mentions and comparison visibility | Competitors mentioned alongside, recommendation and comparison context | Did we make the consideration set |
| Page contribution | URLs used as evidence, internal link structure | What actually contributed |
The strength of this framework is not that it adds more metrics. It is that it separates the role of each metric and what it explains.
1. Read GSC as baseline data
GSC is still your first data source. In the AI search era, though, read it as "baseline data," not as "the answer report." Look at shifts in the share of branded vs. non-branded queries, impression and click trends for core topic queries, and differences in how comparison and problem-solving pages respond.
Search Console is still the most reliable baseline search data, but for now you should not assume it is a standard report that fully separates AI search performance[3]. The key is not to use GSC as an overall scorecard for AI search.
In practice, it is safer to check structural changes before absolute numbers when reviewing GSC data. For example, if clicks on a page dropped while impressions held steady, AI Overviews or other elements may have taken over the top of the results page and lowered only the click-through rate. If impressions and clicks fell together, the problem is more likely the content's own competitiveness. Looking at impressions and clicks side by side is how you tell whether a change comes from the structure of the results page or from content quality.
2. Use GA4 to connect sessions and conversions
GA4 is the layer that tells you "did a real visit happen." What matters here is less total sessions and more which traffic came through which landing page and led to which action. Group the LLM referrals coming from conversational AI tools such as ChatGPT, Perplexity, and Gemini, and also check landing pages that overlap with organic search.
AI search performance does not all show up in referral logs. Users may read only the answer and later search the brand name or type the URL directly. So in GA4 you need to look at three things together: explicit LLM referrals, assisted conversions, and landing page response. Industry data also shows that direct traffic from AI tools is still a small share of total traffic[2], so it is important not to read too much into session counts alone.
3. Prompt tracking shows the decision moments
This is where things differ most from a traditional SEO report. Prompt tracking follows decision moments instead of search volume. A question like "What tool should a company in our industry use to see AI search performance?" is hard to capture with keyword reports alone.
The basic fields to manage in prompt tracking are: prompt ID, question intent (informational, comparison, recommendation, adoption), whether your brand appears, whether competitors are mentioned alongside, whether a recommendation context is included, pages linked as citations or evidence, and notes on answer quality plus change history. The advantage of this approach is that you can read performance around the questions where choices actually get made.
4. Brand mentions and comparison visibility show the consideration context
The mere fact that your brand was mentioned once is not enough. It helps to grade the strength of a mention in this order: plain mention, descriptive mention, comparative mention, recommendation mention, alternative-candidate mention, and adoption-consideration mention. Splitting it this way makes it easier to answer questions like "We show up, so why doesn't it feel like it?" You may well be visible, but if you rarely enter comparison or recommendation contexts, the practical impact is close to nothing.
Record separately the rate at which competitors are mentioned alongside you, your appearance rate in comparison and recommendation prompts, and the question groups where competitors show up and only your brand is missing.
After a few weeks of these records, interesting patterns appear. Often your brand is always mentioned alongside one or two competitors in some question groups and does not appear at all in others. Once you confirm that this split comes from differences in page structure rather than chance, the content team can revisit pages with a concrete question: "Why do we keep dropping out of only this question group?"
5. Page contribution reveals the cause
This is where many teams fall short. They look at AI search performance but never connect it to which pages contributed. It helps to split pages into three layers: direct contributors (pages frequently linked as actual citation evidence), supporting contributors (pages that support understanding through internal links and definitions), and gap pages (areas where the question exists but no page addresses it).
Once you start looking at page contribution, the content team's priorities shift. You end up strengthening pages that support comparison, adoption, and evaluation contexts before high-traffic posts.
A single spreadsheet is enough for your first pass at page contribution. List the core question groups in the left column, and in the right column write the URLs that were actually cited or used as evidence for those questions. As you fill in the table, gap pages, where "no page supports this question group at all," naturally surface. Gap pages are the most concrete action items you can put straight into the content team's plan for next quarter.
A dashboard that ties the five axes onto one page
In practice, you can structure the monthly report like this.
- Executive summary: three lines on the key changes this month. Summarize meaningful changes, not just increases and decreases.
- GSC summary: changes in impressions, clicks, and CTR for core query groups, and in the branded vs. non-branded share.
- GA4 summary: LLM referral sessions, key conversion events, and changes in direct return visits.
- Prompt and brand visibility summary: appearance rate by question group, top patterns of competitors mentioned alongside you, and question groups where you drop out.
- Page contribution summary: the pages that contributed most, new pages to fill missing questions, and existing pages that need updates.
Split the operating routine by cadence
Weekly, check the core prompt set, review changes in competitor co-mentions, and look for anomalies in LLM referral landing pages. Monthly, summarize GSC and GA4 trends, visibility changes by prompt group, and evaluate page contribution. Quarterly, recalibrate KPIs, refresh the question sets, and revamp the report template.
You do not need to follow this cadence perfectly from the start. Many teams find even the weekly prompt check hard at first. In that case, put just your five core questions into the weekly routine and push the rest to monthly. What matters is not filling all five axes perfectly every week but steadily building records in the same format. After a few months of records, patterns like "this question group is always weak" or "this competitor has been mentioned much more often lately" start to appear on their own.
The reason AI search performance is invisible is not a lack of data. It is that the data is scattered across different tools. GSC alone shows only how the results page responded, GA4 alone shows only visits and conversions, and prompt tracking alone shows only question moments. Only by connecting all five can you read where you are visible, where you are compared, and what drove conversions. TRAIL Search regularly observes the prompt tracking and brand and comparison visibility axes, the ones practitioners find hardest to maintain by hand, so you can view them alongside your GSC and GA4 data.
For related reading, see When your AI search citation count is zero: a diagnosis sequence that separates the causes, What is query fan-out? Watching AI split one question into many searches, and Why GEO became a brand reputation problem: when AI describes your brand wrong.
You can continue with Can Search Console's AI report alone measure GEO?, Is AI search visibility enough? Why we changed our question, and What marketers worry about most in AI search: reporting data.
Frequently asked questions
Does GSC have a dedicated report for AI search?
For now, you should not assume GSC is a standard report that breaks out AI search performance on its own. GSC is still the most reliable source of baseline data about the search results page, but if you expect it to filter out AI search separately, your reporting will easily wobble.
If GA4 records almost no LLM referrals, does that mean AI search is not working?
That is hard to conclude. Users may read only the AI answer and later search your brand name, type the URL directly, or come back through another channel. In those cases AI search may have influenced the decision even though GA4's explicit referrals do not show it.
Should I wait until all five axes are in place before starting a report?
No. It is fine to start with prompt tracking. In fact, because there is no standardized single report today, prompt tracking becomes the key layer for practical interpretation. Many teams already use GSC and GA4, so we recommend adding prompt tracking and page contribution first.
References
Summary
- AI search performance has to be read as question-level and consideration-level performance, not just channel performance.
- Five axes, GSC, GA4, prompt tracking, brand mentions and comparison visibility, and page contribution, each answer a different question.
- Fewer clicks do not automatically mean worse results, and more brand mentions do not mean you are doing enough. You only see the real picture when the five axes are connected.
- A stable routine is prompts and competitor mentions weekly, GSC, GA4, and page contribution monthly, and a reset of KPIs and question sets quarterly.
Check this topic against your own brand
TRAIL Search measures how ChatGPT and Perplexity answer your customers' questions and finds and fixes where the brand is missing, turning this post into a diagnosis. Start with 10 questions, no card required.
More posts
Getting cited when Google AI Mode builds the answer
In November 2025 Google put Gemini 3 in AI Mode to build custom layouts and tools per query while keeping links to web sources. Here is what gets cited.
How is AI answer visibility defined and measured?
How is AI answer visibility defined and measured? Three metrics with formulas and paper figures: visibility (GEO), contribution (Shapley), and stability.
The prompt you track is not the query AI actually searched
AI visibility reports score each tracked prompt, but retrieval and citation happen on fan-out sub-queries. What year and English injection mean for measurement.
Keep reading on this topic
- Which content types AI cites, by search intentThe content type AI search cites flips with intent: articles lead informational prompts (45.5%), listicles lead commercial ones (40.9%).
- How are retrieval and citation different in AI search?Retrieval and citation are different stages in AI search. Does ChatGPT cite YouTube? Why our content is missing from AI answers, and what zero citations mean.
- The LLMO trap: training data vs. AI answer citationsSeeding your brand in LLM training data and getting cited in AI answers are different mechanisms. How they differ, what you can measure, and why advice splits.
This post is part of the Analysis category, which collects all 35 posts on the topic. See all posts in Analysis