Which content types AI cites, by search intent
What a 1-million-citation analysis shows: the intent behind a question decides which content gets cited more than industry or model does
The content type AI search cites flips with intent: articles lead informational prompts (45.5%), listicles lead commercial ones (40.9%).
Which content type an AI answer cites depends more on the search intent behind the question than on industry or model. For questions that seek information, articles accounted for 45.5% of citations. For commercial questions that compare options, listicles ranked first at 40.9%[1]. For transactional questions right before a purchase, product pages took the lead. These are not small adjustments of a few points. The top spot changes hands entirely. That is why a one-line average such as "AI loves listicles" rarely works as an accurate benchmark for any brand.
This article is based on an analysis published on Wix Studio AI Search Lab by a Peec AI researcher (published March 23, 2026)[1]. We opened the original page and checked each figure against it, then reconfirmed them as of October 2026. The data is first-party, vendor-held data. It has not been peer-reviewed, and we have not reproduced it. Peec AI also builds AI visibility measurement tools, so it works in the same market we do. We disclose that interest because we intend to carry a competitor's figures as published, without trimming or inflating them, and to add only what those figures cannot separate.
What the study measured and how
The analysis counted 1,056,727 citations from 75,000 AI answers and sorted them by content type[1]. The models were ChatGPT, Google AI Mode and Perplexity, and every prompt was non-branded, with no brand name in it. The five industries were ecommerce, health and wellness, home repair, professional services and SaaS.
Questions were split into four intents: informational (seeking information), commercial (comparing options), transactional (about to buy or act) and navigational/local (looking for a specific place or site). Cited URLs were classified automatically on the Peec AI platform into 11 types: listicles, articles, product pages, category pages, how-to guides, discussions, homepages, profiles, comparisons, alternatives and other.
Start with the overall distribution, with all intents mixed together.
| Content type | Share of all citations |
|---|---|
| Listicles | 21.9% |
| Articles | 16.7% |
| Product pages | 13.7% |
| Category pages | 11.25% |
| Other | 9.92% |
| Discussions | 7.52% |
| How-to guides | 6.21% |
| Homepages | 5.26% |
| Profiles | 5.12% |
| Comparisons | 2.20% |
| Alternatives | 0.29% |
Table 1. The overall citation distribution across all four intents. The top three types (listicles, articles and product pages) make up more than half. Source: Peec AI × Wix analysis[1].
From this table alone, "listicles get cited most" is the natural conclusion. It is also the number that spread most widely across the industry. The problem is that 21.9% is an average of four intents[1]. Split by intent, the picture changes completely.
The top content type flips with search intent
Split by intent, the top content type changes in three of the four cases[1]. Articles ranked first for informational, listicles for commercial, and product pages for both transactional and navigational/local.
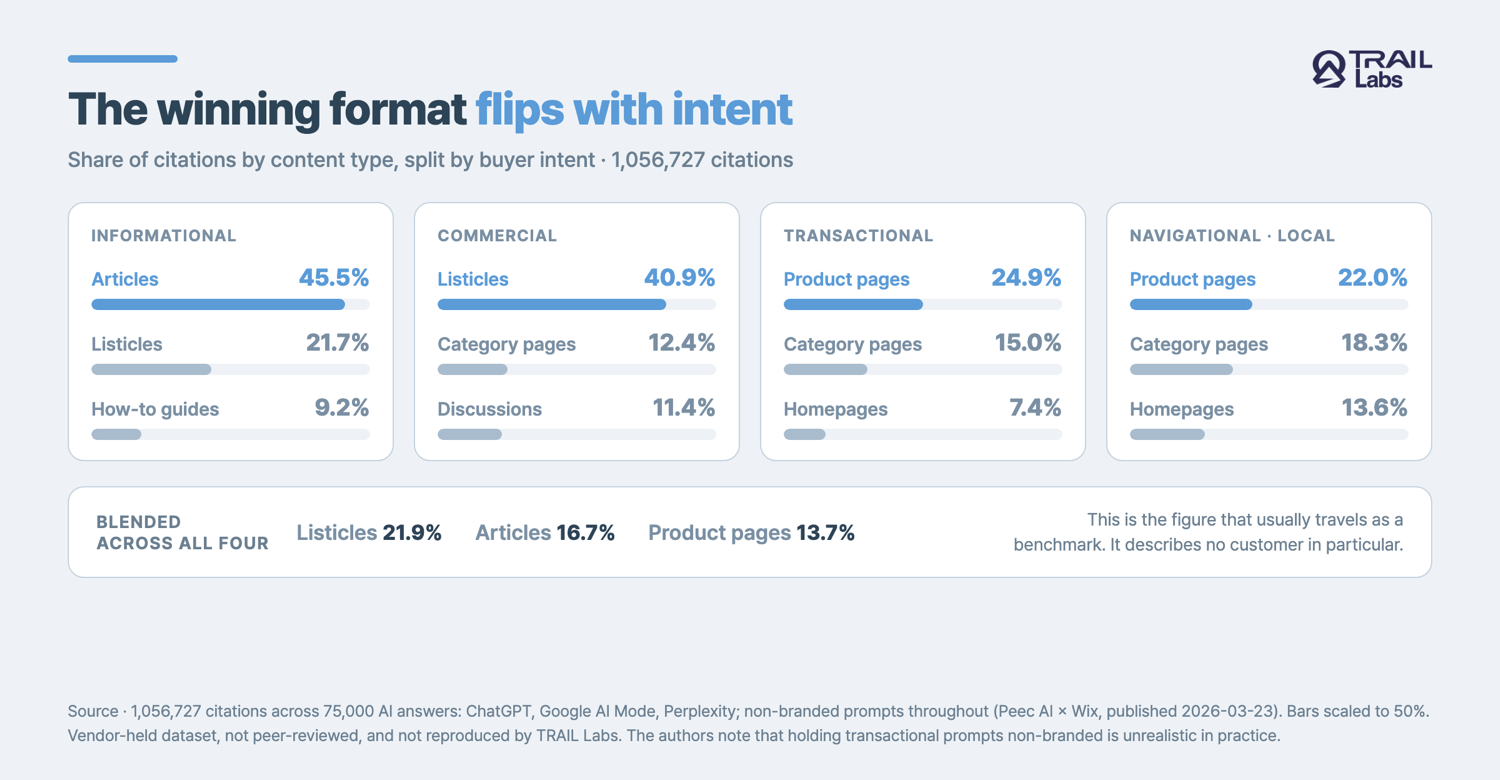
Figure 1. The top three content types by citation share for each search intent, with the blended average across all four intents in the bottom row (listicles 21.9%, articles 16.7%, product pages 13.7%). We redrew the original figures[1] in our palette.
| Intent | 1st | 2nd | 3rd |
|---|---|---|---|
| Informational | Articles 45.48% | Listicles 21.68% | How-to guides 9.21% |
| Commercial | Listicles 40.86% | Category pages 12.42% | Discussions 11.44% |
| Transactional | Product pages 24.88% | Category pages 14.97% | Homepages 7.38% |
| Navigational/local | Product pages 21.95% | Category pages 18.31% | Homepages 13.56% |
Table 2. The top three types by citation share for each intent. We carried over the values exactly as published, to two decimal places[1].
For informational questions, the article share (45.48%) is about 2.7 times the overall average (16.7%). That multiple is our own calculation from the two published figures. For commercial questions, the listicle share (40.86%) is, in the authors' words, 86.7% above average[1]. The authors read this as people asking commercial questions wanting structured comparisons and other people's opinions rather than detailed articles. Discussion pages (11.44%) placing third for commercial intent fits the same reading.
Move to transactional and articles and listicles drop out of the top three. Pages that brands or sellers run themselves move up instead: product pages, category pages and homepages. For navigational/local questions, product pages and category pages together come to just over 40%. That is our own sum of the two published values in Table 2[1]. The same listicle that ranks first for commercial intent doesn't make the top three for transactional. That is what "intent flips the winner" actually looks like.
Search intent is an old idea
Splitting questions by intent has been a basic frame of search research for more than 20 years. In a 2002 paper in SIGIR Forum, Andrei Broder divided web searches into three classes: navigational (reaching a particular site), informational (acquiring information assumed to be on some page) and transactional (performing some web-mediated activity)[3]. In the AltaVista surveys and logs of the time, informational queries made up less than half of all web searches. The classic information retrieval assumption that "users are looking for information" held for only half of the web.
The new analysis adds commercial to Broder's three classes and groups navigational with local, for four in total. Commercial reflects the marketing distinction of "comparing what to buy," the same slot as the commercial investigation intent we covered in our six-step guide to intent-based keyword research. What is new is less the taxonomy than the evidence, from large-scale citation data, that the kind of document AI picks as evidence differs this much by intent.
Traditional search results already looked different by intent. Shopping results came first for transactional queries and official sites for navigational ones. AI answers inherited that structure, and it now shows up in the distribution of cited source types. Explaining AI citations with one blended average erases the most basic distinction search has always had.
Benchmarking against the 21.9% blended average skews the comparison
The blended average is accurate as a number, but the moment you compare an individual brand to it, it produces the wrong conclusion. Take a brand whose tracked questions are mostly commercial. Taking the commercial value in the same data[1] as the reference, a listicle citation share near 40% is normal for that brand. Compare it to 21.9%, though, and the diagnosis reads "over-reliant on listicles," even though the brand is ordinary for its own intent mix.
It skews the other way too. A brand that tracks mostly informational questions can show a listicle share of 21.68%, nearly the same as the average, and look fine. What that brand should really watch is its article share, and the reference point there is around 45%[1]. The same benchmark over-penalizes one brand and over-rewards another. The number is precise and the comparison is wrong.
A citation rate benchmark analysis published earlier by the same researcher shows the same point[2]. It derived recommended citation rates per engine from a dataset whose prompts were evenly split by intent from the start. In other words, those benchmarks assume "a prompt set with intents mixed evenly." If a real brand's prompt set leans toward one intent, the premise doesn't hold.
We covered why listicles are strong for commercial questions from a structural angle in why ChatGPT cites listicles so often. The explanation was that separated items are easy to lift out one at a time. This data adds a condition to that explanation. The listicle's advantage works mainly for questions that call for comparison. For informational or transactional questions, other types take that place.
Model and industry differences are real but smaller than intent
There are clear differences by model and by industry, but they are narrower than the ones intent creates[1]. The authors' concluding sentence was that "query intent was more predictive of content type citation than both industry and model choice."
| Segment | Observation | Versus average |
|---|---|---|
| ChatGPT | Leans toward articles | +4.38 pts |
| Google AI Mode | Most evenly spread across the 11 types | Articles +2.14 pts, discussions -5.51 pts |
| Perplexity | Discussion pages at 17.35% | +9.83 pts |
| SaaS | Listicles at 35.37% | Highest among industries |
| Professional services | Listicles at 25.24% | |
| Ecommerce | Listicles at 19.94% | |
| Health and wellness | Articles at 19.66% | |
| Home repair | Product pages at 18.52% |
Table 3. Differences by model and by industry, with the original figures unchanged[1].
Perplexity lifted discussion pages such as Reddit, LinkedIn and G2 to second place. That +9.83 points is the largest model difference[1]. On the intent side, articles alone show a gap of about 29 points between informational (45.48%) and the overall average (16.7%). Listicles move about 19 points, from 21.68% for informational to 40.86% for commercial. Both gaps are our own calculations from the published figures. Model and industry differences fall inside that range.
Looking at listicles in professional services specifically, 80.9% of the cited listicles were written by third parties, and self-promotional listicles made up 19.1%[1]. That is why "listicles win commercial prompts" doesn't lead straight to "write a top-10 list on your own blog." Most cited listicles are comparisons someone else wrote.
Build prompt sets by intent
What we take from this data is the split itself, not the percentages. The limits section explains why we don't use the percentages as targets. Here are three principles you can apply to measurement design right away.
- Report the intent mix with the score. State in the report which intent mix of prompts produced an AI visibility score. The same score means different things for a set that is 80% commercial and a set that is 80% informational.
- Don't pick prompts by search volume alone. High-volume questions tend to cluster in commercial and transactional intent. Include a minimum number of informational, commercial, transactional and navigational prompts each.
- Compare within the same intent. When you check your brand's listicle share, compare it to the value for the same intent band, not the blended average. Set those band values by measuring your own prompt set rather than borrowing an outside benchmark as is.
A brand that tracks only commercial prompts has not confirmed that it is strong early in the buyer journey. It simply never measured that stage. Unmeasured and zero are different states, but a report that doesn't split by intent can't tell them apart.
This topic started in a discussion under an earlier post on our LinkedIn company page. A commenter argued that buyer journey and intent context matter more than the measurement path, and this article covers the part of that point we can turn directly into measurement design.
One more note: the distribution of content types and "which page wins" are questions at different layers. In the controlled experiment we covered in which of two pages AI cites, once two candidates were already competing, format differences such as paragraph density had almost no effect, and topic match, a stated price, a recent date and early position decided the outcome. The intent distribution shows "which kinds of documents enter the candidate pool," and the competition experiment shows "what wins once candidates go head to head." Be careful not to blend the two into "switch to a listicle format and you'll get cited."
Limits
This analysis uses vendor-held data and has not been peer-reviewed. We have not reproduced the results. By our evidence grading it ranks medium or lower, and we don't use it as grounds to change scoring weights. We use it only as grounds for "what we should split and look at."
The authors also flagged a caveat themselves. In reality, transactional questions often include a brand name because the shopper already knows what they want to buy, but this study kept every prompt non-branded for methodological consistency. The transactional figures are therefore some distance from real transactional search.
Much is also missing from the public page. The number of prompts per intent, the prompts' language and country, the collection period, and the accuracy of the automatic classification into 11 types are not disclosed. This data can't tell us whether Korean-language questions, or domestic search surfaces such as Naver, would show the same distribution.
Finally, what this analysis counted is "each type's share of citations." That is a different metric from the probability that a given page gets cited, or from clicks and revenue after a citation. A high listicle share does not mean that writing listicles causes more citations.
The short version
Ask which content AI search cites, and the accurate answer is "it depends on the intent of the question." Articles ranked first for informational, listicles for commercial, and product and category pages for transactional and navigational/local[1]. The blended average is fine as a one-line summary for reporting, but it isn't the right yardstick for your brand. When you read a score, first check which intent mix produced it, and build your prompt set by intent. That is the most durable lesson this data leaves for practitioners.
Frequently asked questions
Does search intent really change which content types AI cites?
In a published analysis of about 1 million citations, it changed them a lot. Articles ranked first for informational prompts at 45.5%, and listicles ranked first for commercial prompts at 40.9%. Product pages and category pages led for transactional and navigational/local prompts. Keep in mind this is vendor-held data and has not been peer-reviewed.
Can we use the 21.9% listicle share as our target?
We don't recommend it. The 21.9% figure averages four intents, so it doesn't match any particular brand's mix of questions. For a brand that mostly tracks commercial prompts, the same data puts the expected listicle share near 40%. The principle of splitting by intent travels better than the number.
Do ChatGPT and Perplexity cite different content types?
They differ. In the same analysis, ChatGPT cited articles 4.38 points more than average, and Perplexity cited discussion pages such as Reddit, LinkedIn and G2 at 17.35%, 9.83 points above average. Even so, the authors concluded that intent is a bigger differentiator than model or industry.
How should we build a prompt set for AI search tracking?
Don't collect only high-volume questions. Build the set across informational, commercial, transactional and navigational intents, and state in the report which intent mix produced the score. If you track only commercial prompts, you never measured visibility earlier in the buyer journey.
References
- [1]Tom Wells (Peec AI), "The content types most cited by LLMs", Wix Studio AI Search Lab, 2026-03-23
- [2]Tom Wells (Peec AI), "What Does a Good Citation Rate Look Like? Benchmarks From Over 1 Million AI Citations", Peec AI Blog, 2026-02-27
- [3]Andrei Broder, "A taxonomy of web search", SIGIR Forum 36(2), 2002
Summary
- In an analysis published by Peec AI and Wix (75,000 AI answers, 1,056,727 citations), the ranking of cited content types flipped with search intent.
- Articles led informational prompts at 45.5%, listicles led commercial at 40.9%, product pages led transactional at 24.9% and navigational/local at 22.0%.
- The blended average across all four intents (listicles at 21.9%) is widely quoted as a benchmark, yet it doesn't describe any particular brand's intent mix.
- Model and industry differences are real but smaller than the swing intent creates, and the authors named intent as the biggest differentiator.
- Because the data is vendor-held, not peer-reviewed and not reproduced by us, we don't treat the percentages as targets. We take only the principle of measuring by intent.
Check this topic against your own brand
TRAIL Search measures how ChatGPT and Perplexity answer your customers' questions and finds and fixes where the brand is missing, turning this post into a diagnosis. Start with 10 questions, no card required.
More posts
How is AI answer visibility defined and measured?
How is AI answer visibility defined and measured? Three metrics with formulas and paper figures: visibility (GEO), contribution (Shapley), and stability.
The prompt you track is not the query AI actually searched
AI visibility reports score each tracked prompt, but retrieval and citation happen on fan-out sub-queries. What year and English injection mean for measurement.
How are retrieval and citation different in AI search?
Retrieval and citation are different stages in AI search. Does ChatGPT cite YouTube? Why our content is missing from AI answers, and what zero citations mean.
Keep reading on this topic
- The LLMO trap: training data vs. AI answer citationsSeeding your brand in LLM training data and getting cited in AI answers are different mechanisms. How they differ, what you can measure, and why advice splits.
- What marketers worry about most in AI search: reporting dataMarketers worry less about vanishing from AI search than about lacking reliable reporting. We checked whether that differs by company size.
- Should AI visibility be measured through the API or the UI?The same prompts through the ChatGPT API and UI shift brand visibility 41% on average and change cited sources. What to check when choosing a measurement tool.
This post is part of the Analysis category, which collects all 34 posts on the topic. See all posts in Analysis