Should AI visibility be measured through the API or the UI?
When choosing a measurement tool, ask what it measures before you ask how accurate it is
The same prompts through the ChatGPT API and UI shift brand visibility 41% on average and change cited sources. What to check when choosing a measurement tool.
AI visibility measured through the API and the visibility users see in the ChatGPT app (the UI) are not the same value measured slightly differently; they are different values. In a published analysis that ran the same prompt set through both paths, brand visibility moved 41% on average, and even the kinds of sources being cited changed [1]. So when choosing a measurement tool, the first question is not "how accurate is it?" but "what is it measuring?" If the path differs, adding more runs will not close that gap.
Here is the scope of the evidence and our stake in it. The API versus UI comparison figures come from a published analysis by Malte Landwehr of Peec AI, a company that makes AI visibility measurement tools [1]. It is a vendor's public observation, not peer-reviewed research, and we note that it comes from a competing vendor. We have not reproduced these figures. The figures on repeated measurement were checked against the original text of the Don't Measure Once paper and all hold under the paper's experimental conditions [2]. The structural differences between the two paths were confirmed in official OpenAI and Google documentation [3][4]. We run TRAIL Search, which measures AI search visibility.
Why a single score that blends engines is risky is covered in One AI visibility score is risky: ChatGPT isn't Perplexity, and why an unmeasured cell must not be read as zero is covered in How to tell zero from unmeasured in an AI visibility report. This post goes one step earlier: which path the number was collected through.
The same prompt set, run through the ChatGPT API and the ChatGPT app
The design of the published analysis is simple. 555 prompts were each run 47 times in the ChatGPT UI and 47 times in the API, spread evenly over several days in August. That adds up to more than 52,000 chats. Both paths were based on the same GPT-5.6 [1].
The results went beyond noise. Brand visibility changed by 41% on average, and the brand most visible in the UI did not even make the API's top three [1]. Same model, same prompts, and yet the leaderboard changed.
| Metric | UI | API |
|---|---|---|
| Maximum fan-out queries | 20 | 7 |
| Answer length | Baseline | 31% longer |
| Share of citations: listicles | 25% | 4% |
| Share of citations: comparison pages | 18% | 2% |
| Share of citations: product pages + how-to guides | 34% | 63% |
| Share of citations: competitor domains | 38% | 52% |
| Share of citations: editorial | 5% | 1% |
| Share of citations: user-generated content (UGC) | 2% | 0% |
Table 1. Differences when the same prompt set was run through the ChatGPT UI and API (as reported in Malte Landwehr's published analysis, not reproduced by us) [1].
The character of the cited answer sources changes
The gap between the two paths went beyond the same sources moving up or down a little. It changed which kinds of pages get cited. By page type, listicles fell from 25% to 4% and comparison pages from 18% to 2%, while product pages and how-to guides together rose from 34% to 63%. By domain type, competitor domains grew from 38% to 52%, user-generated content went from 2% to 0%, and editorial from 5% to 1% [1].
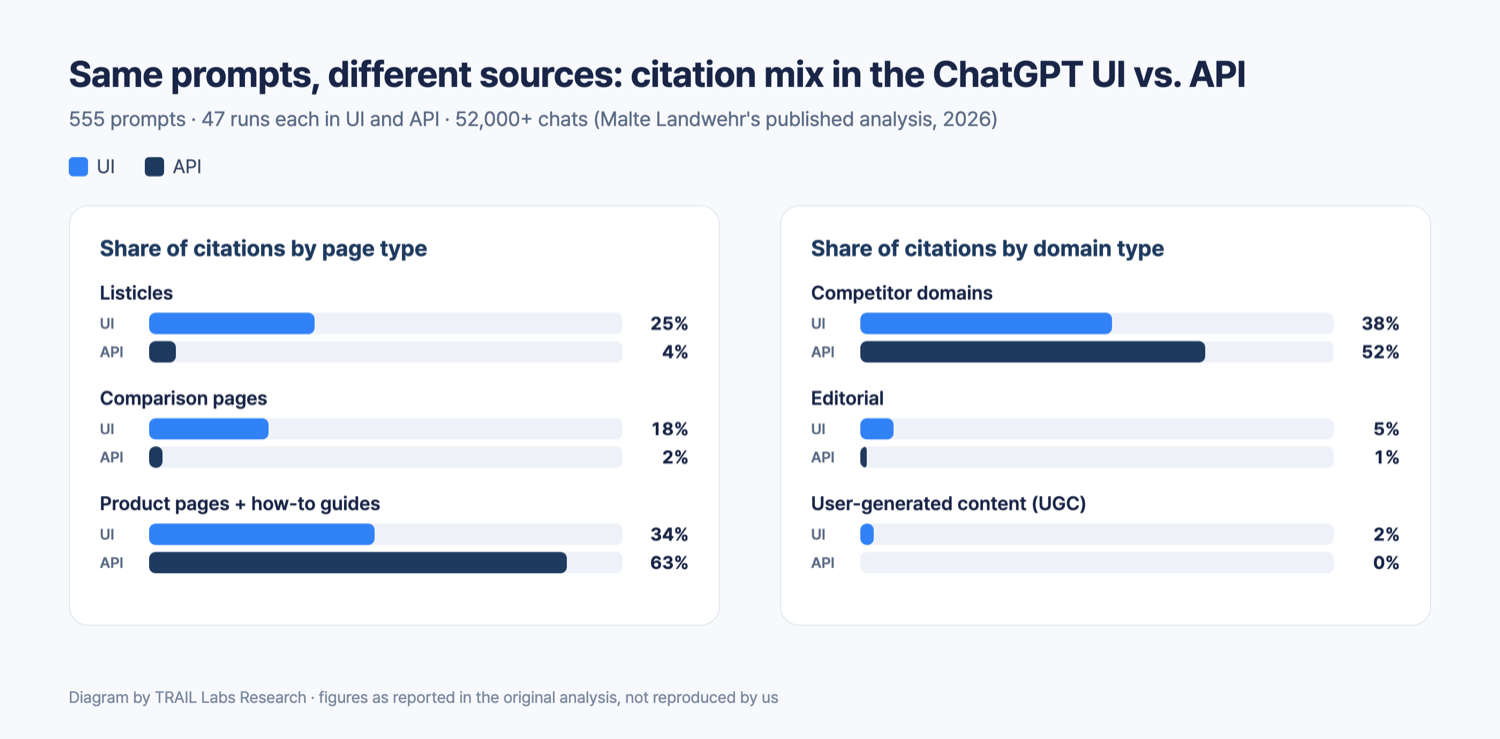
Figure 1. A bar chart placing UI and API side by side for share of citations by page type (listicles, comparison pages, product pages and how-to guides) and by domain type (competitor, editorial, UGC). Figures as reported in Malte Landwehr's published analysis [1].
The tail is more uncomfortable than the average. Two of the top 25 source domains in the UI were not even among the API's top 100 [1]. Some sources are not just cited a bit less; on one path they do not appear at all. API answers were also 31% longer. A different length means a different number of places where citations can go, and a different number of places means a different denominator for share of voice.
The observation that listicles take a large share in the UI points the same way as the pattern covered in Why Does ChatGPT Cite Listicles? Format vs. Hierarchy. The point of this comparison is that the pattern almost disappears when you measure through the API.
Why the ChatGPT API and app cite different sources: different configurations
It makes sense that the API and the UI produce different results once you look at their structure. The author of the analysis attributes the gap to the two paths using different search systems and configurations [1]. Some of the differences can be confirmed in official documentation.
In the API, web search is a tool the developer adds to the request. OpenAI's web search tool documentation explains that, like any other tool, the model chooses whether to search the web based on the content of the input prompt. Under the default tool_choice: "auto", search is optional, and you have to specify required to make it always run [3]. Depending on how the measuring side sets this, results differ even within the API path.
The UI adds product-side settings on top. A system prompt is applied, search fires automatically depending on the question, results vary by account, region, and history, and a different model can be routed to each answer. How one question gets split into multiple sub-searches also differs by path. Google Search Central describes AI Overviews and AI Mode as using a query fan-out technique that issues multiple related searches across subtopics and data sources [4]. That the UI showed up to 20 fan-out queries and the API up to 7 in the published analysis signals that even the pool of citation candidates differs in size [1]. How fan-out actually happens is covered separately in What is query fan-out? Watch AI split one question.
Even within the UI, whether search happens varies by question. The Don't Measure Once study collected its data from web interfaces, and ChatGPT activated web search only for specific queries, leaving 57.8% of its runs with zero citations [2]. Citation-level metrics can only be computed on runs where search actually happened. Since the API's tool_choice setting changes this ratio, the same "ChatGPT citation rate" can have a different denominator depending on path and settings.
Where you collect from is part of the path too. The same authors collected all data from servers located in Switzerland, so prompts were served with Swiss IP addresses and locale settings, which they note may affect geo-personalized index selection, language weighting, and citation patterns [2]. Even through the same UI, which country and language settings you ask from changes the population you are measuring. That is why recording only "API or UI" is not enough.
The API is clean and reproducible. It is just not the environment your customers actually face.
Does running more measurements make them more accurate? Only variance shrinks
Running more measurements reduces variance, but the bias that comes from a different path stays put. This exposes the basic measurement problem. Let be the value you want to know and the value you actually record.
is the bias that comes from the gap between the two constructs, and is the standard error after averaging runs. As grows, the standard error approaches zero. But is a constant. It does not shrink no matter how many runs you add. Looking at both errors together, the mean squared error follows the standard decomposition.
The second term vanishes as grows, but the first stays. So as grows, the estimate converges to , not . The more precise it gets, the more precisely it approaches the wrong value. If you want UI visibility but measure through the API, adding samples fixes the variance and leaves validity unchanged.
The Don't Measure Once authors ran into this problem directly. The study collected all its data from web interfaces, and because mixing API and interface data for ChatGPT would create a methodological inconsistency, they restricted the analysis to January 24 through March 20, 2026, when collection was consistent. They also wrote that future studies should pin collection method and model version across the full observation window [2].
The same brand gets opposite recommendations
The path gap is more than an abstract worry because the recommendations flip. Through the API, product pages and how-to guides take 63% of citations, so the conclusion is "strengthen product pages." Through the UI, listicles and comparison pages together take 43%, so the conclusion is "build comparison content" [1]. The same brand gets next-quarter plans pointing in opposite directions.
The competitive picture looks different too. In the API, competitor domains hold 52%, which reads as "competitors' own pages dominate the answers"; in the UI they hold 38%, so third-party sources look like a bigger share [1]. A number can be precise, but if it points the wrong way you cannot make a decision with it.
Each path fits different questions
This does not mean one of the two paths is the wrong tool. Each path can validly answer different questions.
| What you want to know | Right path | Why |
|---|---|---|
| Comparing model capability | API | Conditions can be fixed and reproduced |
| Isolating the effect of one content factor | API | Experiments can control other variables |
| Checking a new model's behavior early | API | You can call it under the same conditions right after release |
| The answer customers see on screen now | UI | The environment reflects the system prompt, search activation, and personalization |
| On-screen competitive landscape and source mix | UI | As Table 1 shows, the source mix itself changes by path |
Table 2. The measurement path that fits each question. Figures on path differences are as reported in Malte Landwehr's published analysis [1][3].
The practical problem arises when the two paths are mixed. If last quarter was measured through the API and this quarter through the UI, you cannot tell whether the change between them came from the brand moving or the ruler changing. A number that moved because you changed the ruler is not a result. The same problem appears when numbers from different tools sit side by side on one slide.
Why AI search report numbers change so much from quarter to quarter: path and run count
AI search report numbers change a lot from quarter to quarter because the measurement path changed, or because results wobble every time even within one path. Matching the path is not the end of it. Even within one path, results wobble every time. In the Don't Measure Once paper, the Jaccard similarity of cited sources between repeats of the same prompt within 24 hours averaged 0.32–0.43 by vertical, the same range as the day-to-day figure of 0.34–0.42 [2]. Most of the variation comes from model randomness rather than change over time.
In the same paper, the standard error of a per-brand detection rate was 0.246 at two runs and 0.081 at seven, below 0.10 (under the paper's experimental conditions) [2]. Variance clearly shrinks with runs. But that work is unrelated to the bias above. You need two separate tasks: pin the path so stays constant, and add runs to reduce variance.
That is also why, when we show measurement results, we attach how many runs produced a value before the value itself. Fewer than 3 runs is a preliminary estimate, 3 to 6 is medium confidence, and 7 or more is high confidence. These bands are our own rule, set against the standard error figures from the paper above [2]. A report that hands you a single number leaves you unable to use it.
What to check when choosing an AI visibility measurement tool
When you choose an AI visibility measurement tool or receive a report, check four things before reading the numbers.
- Did this number come from the API or the UI? If the report does not answer that, do not compare it with another tool's numbers.
- Are the path, region, and model conditions the same as last time? Do not read a change as a result if the collection country, language settings, search tool settings, or model version changed during the period. The authors also recommend pinning collection method and model version across the full observation window [2].
- How many runs produced this value? A rise or fall from one or two measurements is a preliminary observation.
- Can it be broken down by engine? In a number that blends engines, path differences and engine differences get mixed together.
Limitations
The core figures in this post come from a single external analysis. They are observations from one point in time and one model version (based on GPT-5.6), published by a vendor and not peer reviewed [1]. The author calls it a small test while noting that the result has been reproduced many times. We have not reproduced these figures, and the numbers will change when the model does. The analysis also does not tell us whether Korean prompts show the same gap.
The Don't Measure Once figures come from data on four Swiss-German verticals collected from servers in Switzerland, and the authors list generalization to other regional and language markets as a limitation [2].
Collection cost matters too. UI collection is hard to automate and expensive, so measuring every prompt through the UI is often not realistic. The direction still holds. A different path means a different population, and different populations make two numbers incomparable from the start.
Frequently asked questions
Should AI visibility be measured through the API or the UI?
It depends on the question. To compare model capability or isolate a single factor under controlled conditions, the reproducible API is the right fit. If you want to know what customers see on screen right now, that is a UI question. The trouble starts when the two paths are mixed within one report or from quarter to quarter.
Why do the ChatGPT API and the ChatGPT app cite different sources?
The two paths are configured differently. In the API, web search is a tool you add to the request, and under the default setting the model decides whether to search. In the app, product-side settings shape when search fires, how a question fans out, and how answers are written. In the published analysis, the API showed up to 7 fan-out queries and the UI up to 20.
Does running more measurements shrink the gap between API and UI?
No. Repeated runs shrink the standard error, which is variance. The bias that comes from measuring a different thing, as with API versus UI, is a constant that stays no matter how many runs you add. The estimate converges precisely on 'the value you want plus the bias', not on the value you want.
What should I check when I receive an AI visibility report?
Check whether the number came from the API or the UI, how many runs produced it, and whether the path, region, and model conditions match the previous report. A number without its path cannot be compared with another tool's numbers or read as change over time.
References
Summary
- In a published analysis that ran the same 555 prompts through the ChatGPT UI and API 47 times each, more than 52,000 chats in total, brand visibility shifted by 41% on average.
- The kinds of sources cited changed too. Listicles fell from 25% to 4% and comparison pages from 18% to 2%, while product pages and how-to guides rose from 34% to 63%.
- Repeated runs reduce variance but not the bias that comes from the measurement path. The estimate converges to the true value plus the bias, not the true value.
- The same brand can get opposite recommendations: 'strengthen product pages' through the API, 'build comparison content' through the UI.
- A visibility number needs its measurement path and run count before it can be compared with other tools or read as change over time.
Check this topic against your own brand
TRAIL Search measures how ChatGPT and Perplexity answer your customers' questions and finds and fixes where the brand is missing, turning this post into a diagnosis. Start with 10 questions, no card required.
More posts
How is AI answer visibility defined and measured?
How is AI answer visibility defined and measured? Three metrics with formulas and paper figures: visibility (GEO), contribution (Shapley), and stability.
The prompt you track is not the query AI actually searched
AI visibility reports score each tracked prompt, but retrieval and citation happen on fan-out sub-queries. What year and English injection mean for measurement.
Which content types AI cites, by search intent
The content type AI search cites flips with intent: articles lead informational prompts (45.5%), listicles lead commercial ones (40.9%).
Keep reading on this topic
- How are retrieval and citation different in AI search?Retrieval and citation are different stages in AI search. Does ChatGPT cite YouTube? Why our content is missing from AI answers, and what zero citations mean.
- The LLMO trap: training data vs. AI answer citationsSeeding your brand in LLM training data and getting cited in AI answers are different mechanisms. How they differ, what you can measure, and why advice splits.
- What marketers worry about most in AI search: reporting dataMarketers worry less about vanishing from AI search than about lacking reliable reporting. We checked whether that differs by company size.
This post is part of the Analysis category, which collects all 34 posts on the topic. See all posts in Analysis