Why channel ROI shouldn't be one number: Bayesian MMM
When a marketing mix model returns channel contribution as a distribution instead of a single point, the width of the interval tells you something
A single channel ROI hides whether your data supports it. How to read Bayesian MMM credible intervals, and the roles of data, priors, and experiments.
When you report a channel's ROI as one number, you hide whether the data actually supports that number. A marketing mix model (MMM, a statistical model that looks at channel ad spend alongside sales history and estimates each channel's contribution to sales) infers values that can't be observed directly from past history. So the honest output is closer to "a distribution of beliefs about where the value is" than to a single value. Bayesian MMM returns exactly that distribution, and the width of the credible interval it produces becomes the key information for budget decisions.
First, the scope of our evidence and our interest. We checked the model structure and equations against the Meridian documentation for the open-source MMM framework Google published, its GitHub repository, and the Google Research paper underlying this family of methods [1][5][6]. We reopened the public docs and cross-checked them as of October 2026. The equations in this post are standard MMM definitions, and we make no claims about the specific functional forms, priors, or estimates in any product we run. TRAIL Labs runs TRAIL Perform, which provides MMM and experiment-based ad effect estimation, so we have an interest in this topic. We'll also say plainly that no method guarantees ad performance.
A marketing mix model estimates each channel's contribution from past history
A marketing mix model splits period-by-period sales into the effects of ad channels, non-advertising factors, and unexplained noise. The simplest form looks like this.
is the outcome in period (a KPI such as sales), and is spend on channel in that period. is each channel's response function, capturing carryover, where earlier spend keeps having an effect, and saturation, where efficiency drops as spend grows. are control variables you must include, such as price, seasonality, and promotions. Leave them out and their effects leak into the channel terms, so sales that really came from seasonality get read as coming from ads.
The Meridian model specification extends this structure to the geo level. The standard Meridian model is "a geo-level hierarchical model with non-linear parametric transformations on the media variables" [2]. Coefficients can differ a bit by region, but regions are tied together so they share information. The repository README encourages using geo-level data when available and says national-level models are supported too [5]. The README also states that Meridian works on aggregated data and doesn't use cookies or user-level information.
Ad effects carry over and saturate: adstock and the Hill function
The response function is usually built in two steps. Meridian's default applies carryover (adstock) first, then wraps the result in a saturation (Hill) function [2].
Carryover is the step that lets several past weeks of spend enter this week's sales with decaying weights. Meridian takes a weighted average of spend within a maximum lag , using a decay parameter [2]. The Hill function bends the response into an S-shaped or concave curve as spend grows. sets the point where the effect reaches half, and sets how sharply the curve bends. The documentation also has an option to swap the order of the two functions.
Google's 2017 paper, which first laid out this structure systematically, started from the problem that ads have lagged effects and diminishing returns that linear regression struggles to capture [6]. It proposed flexible functions for carryover and shape, and Bayesian estimation that brings in knowledge from previous or related models as priors. The same paper shows how to compute attribution metrics such as ROAS and marginal ROAS (mROAS) from posterior samples.
Bayesian MMM returns a distribution instead of a single number
None of the parameters in the equation above are observed directly. They are all inferred from history. Bayesian estimation builds that fact into the calculation. You multiply the belief you assumed before seeing the data (the prior) by the evidence in the data (the likelihood) to get the belief after seeing the data (the posterior).
is the observed spend and sales history, and is the assumption you agreed to before seeing it. The Meridian introduction says the model's primary output is "a posterior distribution of model parameters," from which it produces business metrics such as ROI estimates, credible intervals, and response curves [1].

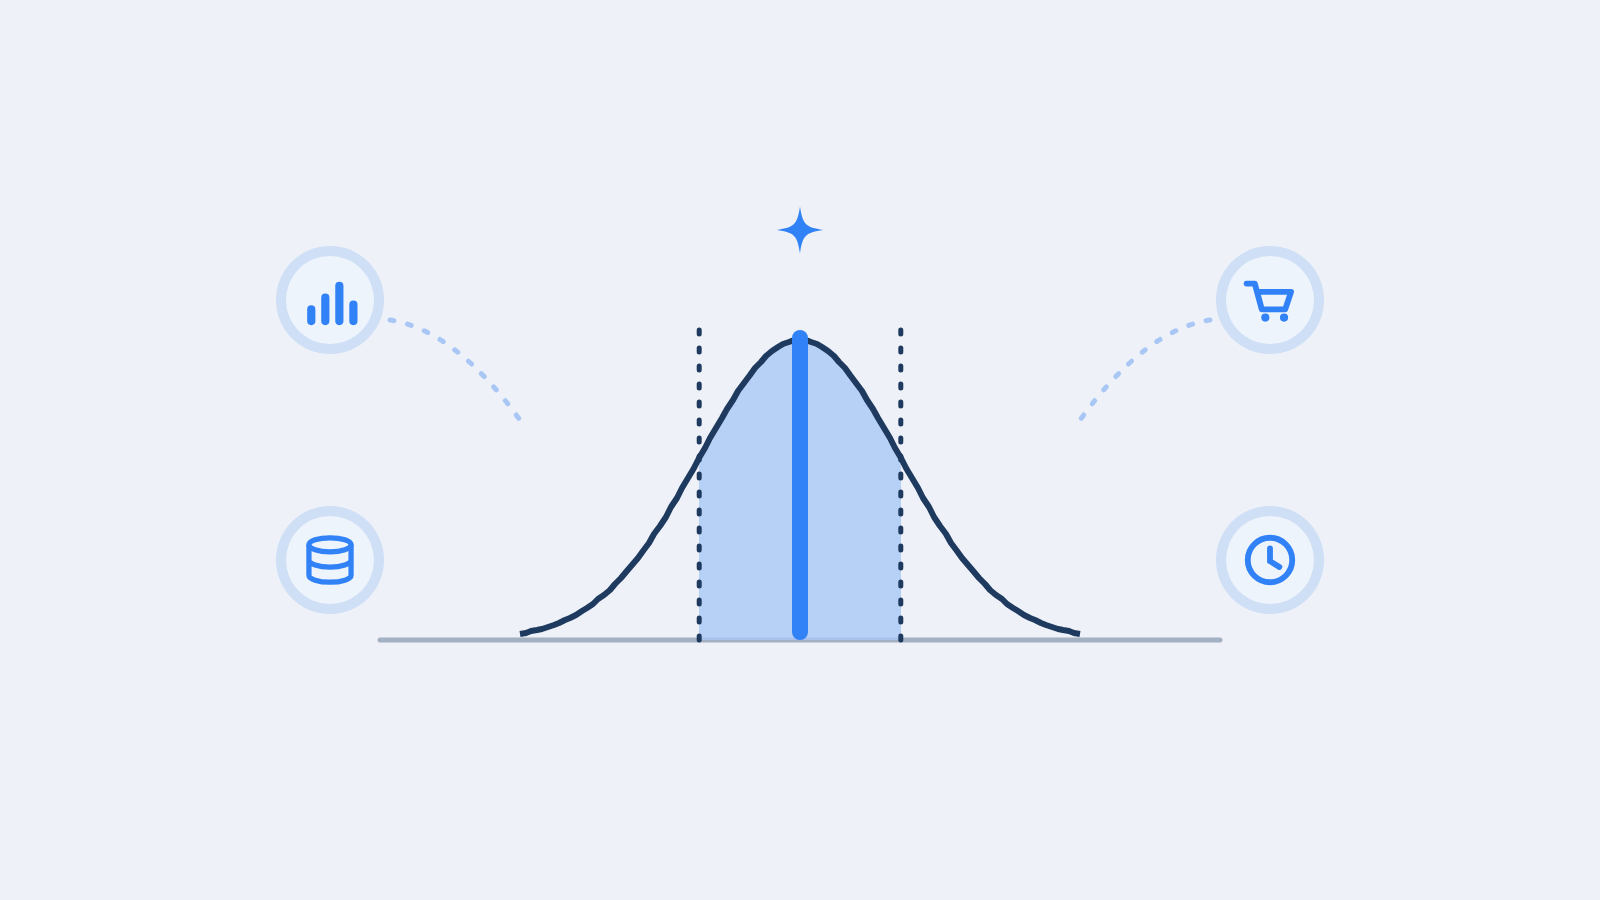
Figure 1. A concept illustration placing the middle interval (shaded) of a bell-shaped distribution side by side with a single bar on one screen. It isn't a chart of actual data.
Once you get a distribution instead of one number, you can say something a point estimate can't.
That reads: "given the observed data and the prior assumptions, there is a 90% probability that channel 's ROI lies between and ." That is a 90% credible interval. Unlike a frequentist confidence interval, it reads directly as a probability about the value itself given the data, which is why it's convenient for practical reporting. Meridian also reports its ROI estimates with credible intervals like this [1].
The width of the credible interval is the finding
How wide the interval is, is a result in its own right. Say a channel's 90% interval runs from 0.8x to 4.1x (a hypothetical example for illustration, not real brand data; intervals like this are a standard Meridian output [1]). That channel isn't a 4.1x channel, and it isn't a 0.8x channel. It's a channel your current data can't yet resolve. Report it as a single midpoint and move budget to match, and you've handed the decision to a coin flip nobody showed you.
| Interval shape | What the data says | What it means for budget decisions |
|---|---|---|
| Narrow and clearly above 1x | The data clearly separates the effect | There's a basis to consider it for an increase |
| Narrow and near or below 1x | The data shows the effect is small | There's a basis to consider a cut |
| Wide and crossing 1x | The effect isn't separated yet | Experiment before reallocating |
Table 1. How to read channel ROI credible intervals by shape. Look at width and position together; the 1x reference line is the point where sales returned equal spend, and the Meridian priors documentation also uses an ROI of 1.0 as the profitability threshold [3].
The original MMM paper points the same way. After applying the model to real shampoo advertising data, Google's 2017 paper wrote that the optimal media mix the model suggests "has a large variance due to the variance of the parameter estimates" [6]. Even the optimal allocation should be seen as a distribution, not a point. So the output worth acting on is less a ranked list of channels and more a separation between allocations that survive the whole uncertainty range and ones that only look good at the midpoint.
Unmeasured and zero are different facts
A point estimate erases this distinction by construction, because it always returns a number, even when the evidence can't support one. It's the same principle we hold to in AI search measurement. Put an unmeasured cell and a zero cell in the same bucket and the report tells a story that isn't true. We covered this principle as engine-level breakdowns in why a single AI visibility score is risky.
The same goes for ad channels. Using the hypothetical example from the previous section, "ROI 1.9x" and "ROI 0.8–4.1x, not yet separable" can come from the same midpoint, but they are different facts. The first conveys confidence; the second conveys the limits of the data. Meridian likewise derives both ROI estimates and credible intervals from the posterior [1]. If a single dashboard shows channel performance without intervals, channels with wide intervals and channels with narrow ones end up looking equally weighty. We laid out how to report the contribution of touchpoints that leave no click, like AI search, in our AI search attribution reporting framework.
With too little data, intervals stay wide and priors weigh more
Models like this need enough spend and sales history to pull channels apart. The Meridian data requirements page recommends several data points per model parameter [4]. In its example, a national model with two years of weekly data (104 points) and 26 parameters has four points per parameter, which it calls "too low to estimate the model reliably." As alternatives it lists combining channels, reducing the number of knots for time effects, removing control variables that don't act as confounders, or extending to three or more years of weekly data. The same page says MMM is a macro tool that works well at the channel level, so running it at the campaign level isn't recommended.
| Data condition | What happens to the posterior | Response |
|---|---|---|
| Short history | Intervals stay wide | Extend the period or reduce parameters |
| Channels move together (collinearity) | Channel contributions can't be separated | Group channels or separate them with experiments |
| Weak data | Priors carry more weight | Document the basis for your priors |
Table 2. How Bayesian MMM results change under different data conditions. Our summary of the Meridian documentation and Google's 2017 paper [4][6].
A posterior that stays wide under a short or collinear history doesn't mean the model is broken. It's the model honestly saying "I don't know." The 2017 paper's simulations likewise reported that estimation works well with large datasets, but with small samples the priors strongly influence the results [6]. So priors go beyond a technicality. They are an input you have to explain and defend alongside the results. The Meridian priors documentation also says the default priors are "moderately informative," and that the prior's standard deviation sets how much weight goes to your initial belief versus the evidence in the data [3].
Experiments are how you narrow an interval
Correlational history doesn't become causal because a model fits it well. The way to narrow an interval is to run experiments, not to fit the model harder. Meridian's documentation says incrementality experiments (comparing a group with ads on against a group with ads off to measure the pure added effect) are perhaps the strongest basis for setting priors, while adding that translating experiment results into priors isn't a precise formula [3]. Experiments are tied to specific time windows, regions, and campaign settings, and their baseline for comparison can differ from the MMM's, so the two numbers often aren't measuring the same thing (the same estimand) to begin with.
This concern predates Meridian. Google's 2017 paper by Chan and Perry laid out the challenges MMMs face in consistently giving valid answers about media effectiveness, and the opportunities for better inference [7]. In practice the order comes down to this. Look at channel intervals from the model first, confirm the channels with wide intervals and large budget shares through experiments, feed those results back as priors, and estimate again. That loop is how intervals get narrower.
Limits
We'll also be clear about what this post doesn't cover.
- MMM is useful when there's enough ad and sales history. If spend history is short or data is thin relative to the number of channels, intervals stay wide, and reallocations made in that state aren't supported by the data.
- Priors change results. The same data can yield different posteriors under different prior assumptions, and the weaker the data, the bigger the difference. That's why the basis for priors should be published along with the results.
- Model fit doesn't prove causation. Leave out a control variable and its effect leaks into the channel terms, and fit metrics often don't reveal that error.
- It's a channel-level tool. Meridian's documentation doesn't recommend campaign-level analysis either [4]. Creative and campaign decisions need other evidence.
- This post doesn't evaluate any specific implementation. The equations are standard definitions from public documentation, and the example interval (0.8–4.1x) is a hypothetical value for illustration. It isn't a report of any real brand's channel ROI.
Wrap-up
Take channel ROI as an interval instead of one number and you see both what the data has separated and what it hasn't yet. Bayesian MMM computes that interval through the posterior distribution, and the interval's width becomes the information for deciding whether to move budget or run an experiment first. That's also why TRAIL Perform publishes its assumptions and uncertainty alongside its MMM and experiment-based effect estimates. We would rather hand over a wide interval with its assumptions attached than a confident number we can't defend. For the order in which to change your performance metrics more broadly, continue with KPIs for the AI search era.
Frequently asked questions
What is a marketing mix model (MMM)?
It's a statistical model that takes past ad spend by channel alongside sales history and estimates how much each channel contributed to sales. Non-advertising factors like price, seasonality, and promotions go in as control variables, and functions capture carryover (ad effects that linger over time) and saturation (diminishing efficiency as spend grows).
How do you read a credible interval in Bayesian MMM?
Read it as: given the observed data and the prior assumptions, there is a 90% probability that this channel's ROI falls within this range. A narrow interval means the data separated the channel's effect well; a wide one means it hasn't yet. The width itself is information you need for the decision.
Should you reallocate ad budget based on MMM results?
Separate allocations that hold up across the whole interval from ones that only look good at the midpoint. Moving budget on the midpoint of a wide interval means making a decision the data doesn't support. For channels with high uncertainty, run an experiment to narrow the interval first.
How much data does an MMM need?
Meridian's documentation recommends several data points per model parameter. Its example: two years of weekly data (104 points) with 26 parameters gives four points per parameter, which it calls too low to estimate the model reliably. It suggests combining channels, trimming control variables, or extending to three or more years of weekly data.
References
- [1]Google, "An introduction to Meridian", Meridian documentation
- [2]Google, "Model specification", Meridian documentation
- [3]Google, "Calibrate treatment priors", Meridian documentation
- [4]Google, "Amount of data needed", Meridian documentation
- [5]google/meridian, GitHub repository README
- [6]Jin, Wang, Sun, Chan & Koehler, "Bayesian Methods for Media Mix Modeling with Carryover and Shape Effects", Google Research (2017)
- [7]Chan & Perry, "Challenges and Opportunities in Media Mix Modeling", Google Research (2017)
Summary
- A marketing mix model (MMM) estimates each channel's contribution from past spend and sales history, along with response functions such as carryover (adstock) and saturation (Hill).
- Because Bayesian MMM returns channel ROI as a posterior distribution instead of a single number, it can state a credible interval such as "90% probability that ROI is in this range."
- A wide credible interval doesn't mean the model is broken. It's an honest result that says the data can't yet separate that channel.
- With short histories or channels that move together, intervals stay wide and priors carry more weight. Priors are an input you have to explain, not a technicality.
- The way to narrow an interval is incrementality experiments, not more model fitting. Base budget decisions on allocations that survive across the whole interval.
Check this topic against your own brand
TRAIL Search measures how ChatGPT and Perplexity answer your customers' questions and finds and fixes where the brand is missing, turning this post into a diagnosis. Start with 10 questions, no card required.
More posts

How is AI answer visibility defined and measured?
How is AI answer visibility defined and measured? Three metrics with formulas and paper figures: visibility (GEO), contribution (Shapley), and stability.
The prompt you track is not the query AI actually searched
AI visibility reports score each tracked prompt, but retrieval and citation happen on fan-out sub-queries. What year and English injection mean for measurement.

Which content types AI cites, by search intent
The content type AI search cites flips with intent: articles lead informational prompts (45.5%), listicles lead commercial ones (40.9%).
Keep reading on this topic
- How are retrieval and citation different in AI search?Retrieval and citation are different stages in AI search. Does ChatGPT cite YouTube? Why our content is missing from AI answers, and what zero citations mean.
- The LLMO trap: training data vs. AI answer citationsSeeding your brand in LLM training data and getting cited in AI answers are different mechanisms. How they differ, what you can measure, and why advice splits.
- What marketers worry about most in AI search: reporting dataMarketers worry less about vanishing from AI search than about lacking reliable reporting. We checked whether that differs by company size.
This post is part of the Analysis category, which collects all 34 posts on the topic. See all posts in Analysis