Why Your Business Doesn't Show Up in AI Recommendations
Documentation gets a venue onto the AI's list; star rating only decides the order once it's there
Why your business doesn't show up in AI recommendations: 85.6% of 4,776 Bali venues were never recommended. Documentation set entry; star rating set rank.
Documentation, not star rating, decides whether a venue gets onto an AI recommendation list, and rating only decides the order among venues that are already on it. That is the conclusion of an audit that enumerated every restaurant, cafe, and bar in two Bali markets, 4,776 venues in all, and then asked four AI systems for recommendations [1]. Venues with an own website, more reviews, listed prices, and web mentions made the lists; star rating had no statistically detectable association at that stage. And 85.6% of all venues were never recommended by any system over seven days.
We wrote this post from the full paper on arXiv (v1), checking the numbers in the text against its tables and figures. Every number here is from the paper's experiment, and we did not reproduce it. The paper discloses that its funder sells review-management and AI visibility tools to restaurants and hotels, a conflict of interest it states up front, and it says the hypotheses and analysis plan were pre-registered before collection [1]. We also run an AI search diagnosis tool, so we have marked separately where the last section connects to our product.
In AI visibility measurement, why is absence unmeasured without a census?
Without knowing the population, "never recommended" is not something you can measure. Most AI visibility audits start from a list of brands or a sample and count which ones show up in answers. That lets you compare relative prominence, but it can't tell you what share of the whole market is missing. You can't separate venues that were filtered out by the algorithm from venues that simply weren't in the sample.
This paper built that denominator directly [1]. It fixed greater Canggu and greater Ubud in Bali as bounded geographic areas and enumerated five place types (restaurant, cafe, bar, coffee shop, bakery) with Google Places Nearby Search. Because one request returns at most 20 results, any grid cell that came back with exactly 20 was split into four cells of half the radius, down to a 130 m floor. That prevents dense centers from being silently truncated. Completing the grid took 760 requests.
Next, names the AI systems mentioned that were not in the grid were added through text search. These were venues with unusual listing types, such as hotel restaurants and coworking cafes. About 220 candidate names were probed, and most turned out to be venues the grid already had. Seventy venues in the final census came in this way, and the census holds 4,776 venues in total [1]. The author separately checked the census for gaps with a capture-recapture analysis against an independent enumeration, the Foursquare open POI dataset.
What this design buys is one number: the share of venues never recommended, the absence rate. An earlier large-scale audit also reported that 48–52% of long-tail brands never surface, but its denominator was a curated list of 533 brands [3]. The author states this is the first study to report an absence rate against a denominator that counts an entire real market [1].
Setup: 96 queries, 4 systems, 2,208 runs
The queries are first-person narrative requests of the kind a real traveler would write. Eight personas, six templates per persona, and two areas gave 96 unique queries [1]. The six templates deliberately reword the same intent, so the study can later measure how much recommendations move when only the phrasing changes.
| Item | Value |
|---|---|
| Personas | Digital nomad, couple on a date, business meeting host, budget backpacker, family with children, vegan or dietary-restricted diner, specialty-coffee enthusiast, late-night group |
| Queries | 8 personas × 6 templates × 2 areas = 96 |
| Systems | ChatGPT (gpt-5.2), Claude (claude-sonnet-5), Gemini (gemini-3.5-flash), Perplexity (sonar), all via search-grounded APIs |
| Runs | Perplexity 960, Gemini 480, OpenAI 480, Claude 288, 2,208 total |
| Period | 7 days, with repetitions spread across days |
| Output | 12,439 valid venue mentions |
Table 1. Measurement design of the confirmatory collection [1].
To claim an absence rate, you have to separate "not seen because extraction failed" from "actually not recommended." So the paper validated the extractor that pulls venue names from answers and the matcher that links names to the census, separately [1]. A second model labeled 95 runs independently and a human adjudicated disagreements, giving mention-level precision of 97.6% and recall of 99.1%. Matching scored about 98–99% population-weighted accuracy in a 100-mention audit, and 87.9% of valid mentions resolved to a census venue.
The paper also reports a case where validation changed a conclusion. After name-matching errors were fixed, the Foursquare listing variable, which had shown a significant positive effect (OR 1.70) in the preliminary analysis, became null (OR 0.84) [1]. The matching errors happened to correlate with venues missing from Foursquare. The hours-listed variable was also excluded from interpretation once it turned out to encode the collection path, because the supplementary lookup had omitted the hours field.
85.6% were never recommended
Of 4,776 venues, 85.6% (4,087) were never recommended by any system in any of the 2,208 runs [1]. Those runs produced 9,791 recommendations in total, but the recommendations reached only 689 venues. Narrowing to the 4,431 confirmed-operational venues gives 85.8%, and narrowing to the 2,173 established venues with at least 50 Google reviews still gives 72.6%.
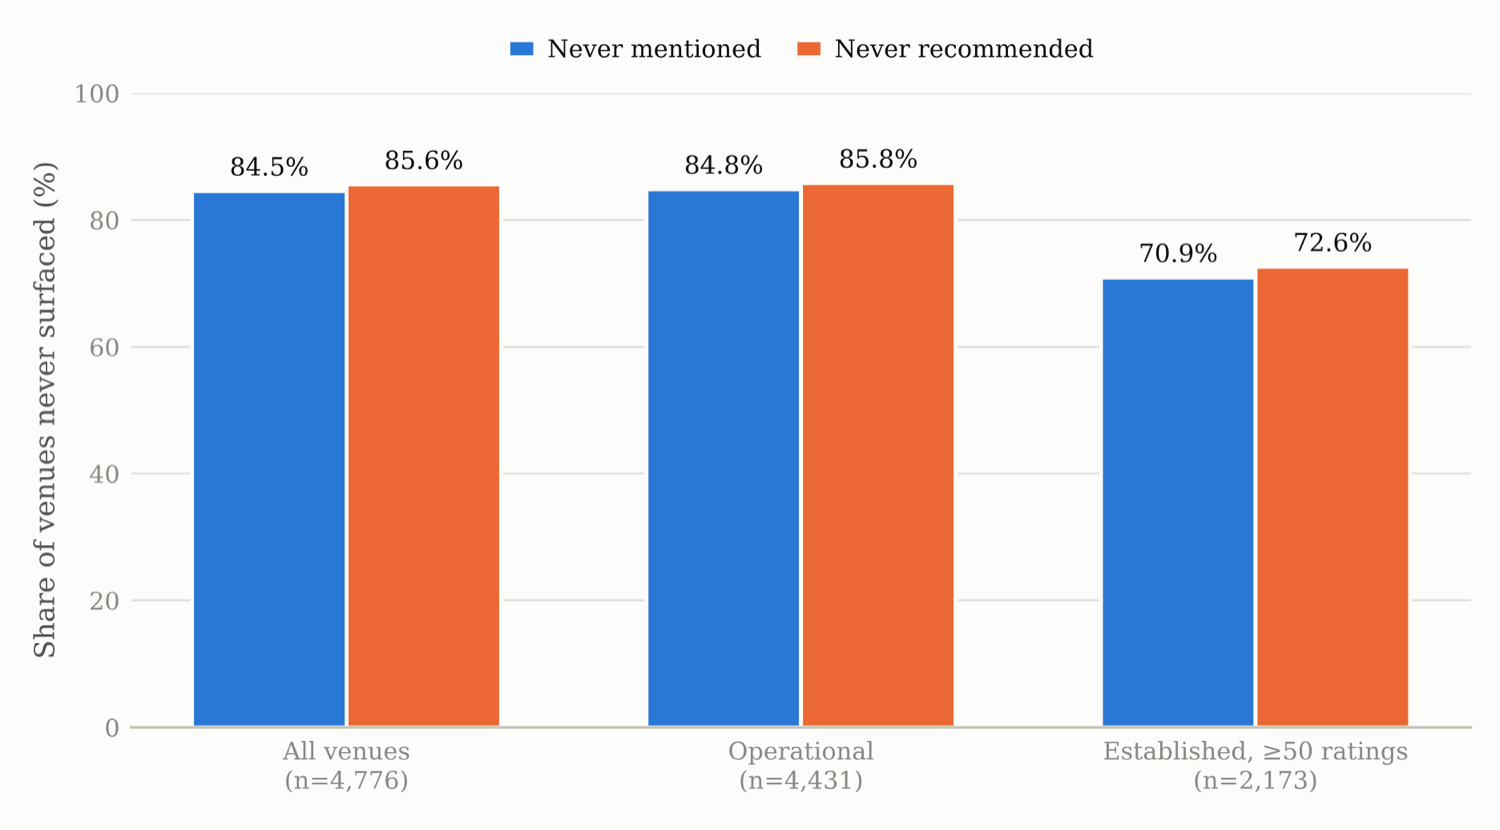
Figure 1. Absence rate by denominator. Blue bars are the share never mentioned (84.5%, 84.8%, 70.9%) and orange bars the share never recommended (85.6%, 85.8%, 72.6%). From left: all 4,776 venues, 4,431 operational venues, 2,173 venues with 50+ reviews [1].
The author calls these values floors [1]. Venues missing from the census are almost certainly never recommended, so widening the census only pushes the rate up. Under the broadest frame it exceeds 92%. The 50-review cut matters because it is hard to dismiss that group as marginal businesses with no real presence. Close to three out of four established venues were invisible in AI recommendations.
The visible side was not winner-take-all. The single most-recommended venue held 1.9% of all recommendations, and the Gini coefficient among recommended venues was 0.668 [1]. The top 5 took 7.7%, the top 10 took 13.8%, and the top 25 took 28.5%, a long-tail structure. The author sums it up as a severe entry filter followed by a comparatively open field. Getting recommended at all is the scarce event, and once in, no small group monopolizes the answers.
Do higher star ratings help you get onto an AI recommendation list?
Higher star ratings did not help venues get onto the AI recommendation list, and helped only with rank among venues already on it [1]. The paper's core finding is that when recommendation is split into entry and rank, different variables move each stage. The probability that a venue is recommended first breaks into two terms.
is the event that the venue makes the recommendation list, and is the event that it is named first on that list. The right-hand term is the entry threshold and the left-hand term is the rank threshold. The paper estimated the two with separate models.
The entry threshold was estimated with a pre-registered binomial GLM [1]. The unit of analysis is venue × persona × engine, with engine and persona fixed effects and standard errors clustered by venue. Benjamini–Hochberg correction was applied across nine hypothesis variables. The model covers 1,407,600 venue-level chances to be recommended, 9,214 successes, and 1,275 venues. Those 1,275 come from a case-control sample: 749 venues with at least one matched mention plus 620 controls stratified by area, rating, and review-count bins, filtered by operating status and the presence of a rating.
holds venue 's documentation and reputation variables, and and are engine and persona fixed effects. Continuous variables are standardized, so an odds ratio (OR) is how many times the odds of being recommended multiply when that variable rises by one standard deviation.
The rank threshold uses only the 1,855 runs that recommended at least two matched venues, and a conditional logit estimates who was named first within each run's candidate set [1]. There were 8,450 candidates in total. This model has no pre-registered multiple-comparison correction, so its p-values are uncorrected.
is the set of venues recommended in run . Because candidates are compared only within the same answer, differences between engines or queries cancel out automatically.
| Variable | Entry OR (adj. p) | Rank OR (p) | How to read it |
|---|---|---|---|
| Has own website | 1.92 (<.001) | 1.33 (.012) | Largest entry effect, weaker at rank |
| Review volume (log, per SD) | 1.64 (<.001) | 1.30 (<.001) | Significant at both |
| Price listed | 1.54 (.010) | 1.32 (<.001) | Significant at both |
| Web mentions (log, per SD) | 1.44 (.010) | 0.92 (.206) | Significant at entry only |
| Review recency (per SD) | 1.41 (.054) | 1.01 (.890) | Borderline at entry |
| Review and blog domain count (per SD) | 0.90 (.134) | 1.23 (<.001) | Significant at rank only |
| Star rating (per SD) | 0.89 (.135) | 1.17 (<.001) | Significant at rank only |
| Listed on Foursquare | 0.84 (.252) | 0.86 (.014) | Null at entry; negative rank sign not interpreted |
Table 2. Odds ratios for the same variables at the entry threshold (paper Table 1) and the rank threshold (paper Table 3). The hours-listed variable, excluded from interpretation because of collection-path contamination, is omitted [1].
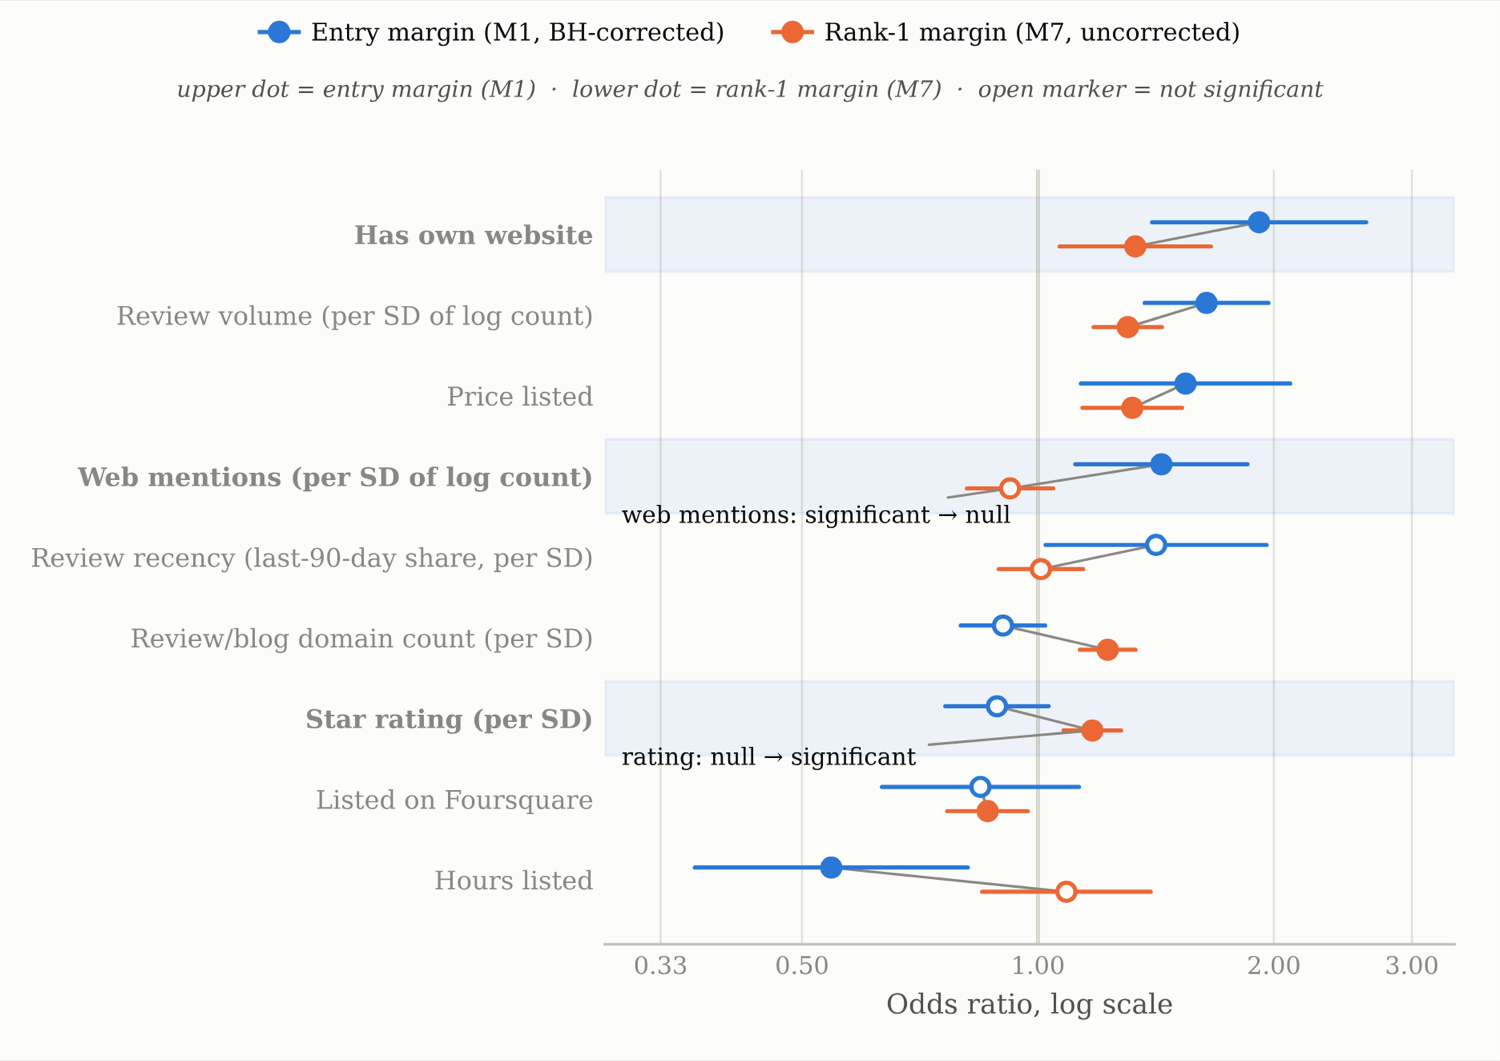
Figure 2. The two-threshold structure. For each variable, the upper dot (blue) is the entry-threshold odds ratio and the lower dot (orange) is the rank-1 odds ratio. Open markers are not significant. In the two highlighted rows, web mentions go from significant to null and star rating goes from null to significant [1].
Read the table and the picture sharpens. All four variables significant at entry measure how much is on record about the venue: whether it has a website, whether reviews have piled up, whether prices are listed, and whether other web pages mention it. Once review volume and documentation are controlled, star rating has no association with entry. In the author's words, be documented before being excellent [1]. A 4.9-star cafe with a thin record is, to these systems, indistinguishable from one that does not exist.
At rank, the picture flips. Among recommended venues, rating becomes significant (OR 1.17), and review and blog domain count, null at entry, becomes significant too (OR 1.23). Web mentions, on the other hand, lose their effect at rank. The author reads this through the retrieve-then-generate architecture [1]. Entry is filtered upstream, by whether the venue exists in the listicles, review aggregators, and own sites the model retrieves; rank is set downstream, when the model composes an answer from retrieved candidates and can attend to quality cues like rating.
This structure also resolves an apparent conflict with earlier work. A hotel conjoint experiment that randomized hotel attributes across twelve LLMs reported that a top rating raises selection probability by 31.6 percentage points [2]. That design puts every candidate in front of the model from the start, so it can only observe the rank threshold. This paper also finds a rating effect at the rank threshold, so the two studies measured different stages of the same pipeline.
AI recommendations fail through staleness more than invention
AI rarely invented venues; the practical problem was that it kept recommending venues that had closed [1]. Before recovery, 2,452 mentions (19.7% of valid mentions) did not match the census. The author checked each name on the web and classified them.
| Type | Size |
|---|---|
| Name variants (rebrands, nicknames, spelling differences), recovered | 941 mentions, 38.4% of unmatched |
| Recommendations of confirmed-closed venues | 14 venues, 93 mentions |
| Real venues outside the study area | 2.4% of unmatched |
| Apparently invented venues | 1 venue, 10 mentions, 0.08% of valid mentions |
Table 3. Classification of unmatched mentions. Shares are for the confirmatory collection [1].
Invention came down to a single name among more than 12,000 valid mentions. Meanwhile, 14 closed venues were recommended 93 times. The author sums it up this way: the risk is not that AI invents restaurants, it is that AI remembers restaurants that no longer exist [1]. A closed cafe's reviews, listicle entries, and blog mentions stay online after it shuts, and those traces are exactly the documentation signals the entry threshold rewards. The record that created visibility keeps the venue visible after it is gone. A sample-based audit would have counted most of those 93 as successes; detecting closures independently was possible only because of the full census.
Why do ChatGPT and Perplexity restaurant recommendations change every time?
All four engines substantially changed their lists when sent the same query again, and the author attributes this to stochastic sampling by the model more than to change over time [1]. Mean top-20 Jaccard similarity between repeated runs was 0.45 for Gemini, 0.40 for Perplexity, 0.29 for OpenAI, and 0.22 for Claude. Queries reworded without changing their meaning scored lower on all four engines, with the biggest gaps for Perplexity (0.19 vs. 0.40) and Gemini (0.30 vs. 0.45). This pattern, where rewording moves results more than a plain rerun, matches what a study of paraphrase brittleness in commercial RAG recommendation reported earlier [4].
The interesting part is time. In a 144-run retest of 16 queries on all four engines two weeks after collection, cross-period similarity (pooled Jaccard 0.375) was comparable to the same-day rerun baseline [1]. On that basis, the author reads the churn as stochastic sampling by the model rather than drift over time. Visibility is a persistent property of the venue, observed through a noisy channel.
Engines also disagreed a lot. Pairwise Jaccard between engines' top-20 sets ranged from 0.33 for Perplexity and OpenAI to 0.54 for OpenAI and Claude; only 8 venues made all four engines' top 20, and 15 made exactly one [1]. The author draws a practical conclusion directly: a single-shot, single-engine visibility check measures noise, and meaningful measurement requires repetition across engines and phrasings.
The paper also shows part of what these systems read. The 26,993 grounding citations attached to runs spanned 986 domains, and the most-cited domain was a single venue's own website (5.3%) rather than a large platform, ahead of TripAdvisor (2.3%) [1]. It is a real-world case of venue-owned content out-citing a large platform. One caveat: Gemini's API returns only Google's grounding-redirect URLs, so the author recovered the actual domains from citation titles.
Limitations of this study
These results are associations from an observational study and should not be read as causal effects [1]. The author's own example is the website variable. Professionally run venues both keep websites and build a large digital footprint, so even after controlling for scale through review volume and web mentions, unmeasured professionalism may be mixed into the website effect. The rank-threshold coefficients are also conditional on entry and can carry selection effects.
The scope is narrow, too. It covers two adjacent markets in Bali, food and drink only, English queries, and a demand mix of tourists and remote workers [1]. Prior work shows results change with language and region, and the author warns against generalizing before replication in a structurally different market. The time window is seven days of collection plus a retest two weeks later, so stability across model generations is unmeasured. The queries are local-discovery requests, and the paper gives no basis for extending the findings to informational questions or B2B purchase questions.
There are limits in the measurement path as well. The audit covered search-grounded APIs rather than the consumer apps, and provider-side configurations can change without notice [1]. Claude's searches were capped at two per run for cost reasons, though the conclusions held when the Claude arm was dropped. Three pre-registered hypothesis variables (similarity between review text and query intent, cross-platform consistency, and social presence) could not be tested at all for lack of data.
The conflict of interest also needs to be kept in mind. The funder sells tools that sit right next to this research question [1]. The author points to pre-registration, freezing the analysis dataset, reporting validation failures, and publishing commercially inconvenient null results (Foursquare listing, and star rating at entry) as the safeguards. We did not reproduce this experiment, and whether the same structure appears for Korean-language queries and Korean search surfaces has not been checked.
What does it take to get onto an AI recommendation list? AEO and GEO practice
Getting onto an AI recommendation list takes building up the record before polishing reputation, which is this paper's most direct implication [1]. Having an own website, filling out platform profiles including prices, and growing review volume and third-party mentions were the variables that moved the entry threshold. To borrow the author's sentence, raising a rating from 4.3 to 4.7 without growing the documentation trail should not be expected to change whether AI puts the venue on its list.
The second implication is about measurement. Entry and rank have different predictors, so merging them into one score erases which threshold you got stuck at. More web mentions helps with entry; broader review and blog domain coverage helps with rank. The same "low visibility" calls for different recommendations. This is evidence in the same direction as what we argued in Zero AI search citations? Diagnose the cause step by step, where we split the path before reading the outcome number, and in One AI visibility score is risky, where we stressed breaking results down by engine. Which of two pages will AI cite?, which isolated the conditions of citation competition on the content side with a controlled experiment, also named listed prices as a gatekeeper, and listed prices were significant at this paper's entry threshold as well.
From TRAIL's side, this paper pins down a limit of our own diagnosis. We have held to the principle that 0% and an unmeasured cell are not the same number, and this paper pushes that principle into method [1]. Without a known population, absence is not measurable in the first place. TRAIL Search does not have a full census of a customer's category. So when a brand does not appear in the prompts we track, we do not stretch that into "invisible in the category"; we write it only as "did not appear in that prompt set." Keeping those two in separate columns is the minimum we can do today. And the paper's results on rerun and rewording churn add one more reason not to judge visibility from a single query.
Frequently asked questions
If I raise my star rating, will AI recommend my business more often?
In this study, star rating had no statistically significant association with whether a venue made the recommendation list (OR 0.89, adjusted p=.135). Rating mattered only among venues already recommended, in deciding which one was named first (OR 1.17). Documentation such as a website, review volume, and listed prices comes first; rating is a next-stage variable.
How many businesses never show up in AI recommendations?
Of 4,776 restaurants, cafes, and bars in two Bali markets, 85.6% were never recommended by any of four systems across 2,208 runs over seven days. Even among established venues with 50 or more reviews, the figure was 72.6%. The author treats these as floors; under the broadest frame the rate exceeds 92%.
Do AI recommendations change if you ask the same question again?
A lot. Repeating the same query gave a top-20 Jaccard similarity of 0.22–0.45 depending on the engine, and rewording the query without changing its meaning gave even lower similarity. A retest two weeks later looked about the same as a same-day rerun, so the author reads the churn as stochastic sampling by the model rather than change over time.
Does AI make up businesses and recommend them?
Rarely, in this study. Only one apparently invented venue appeared, in 10 mentions, or 0.08% of valid mentions. The bigger problem was 14 confirmed-closed venues recommended 93 times, and the author concludes the practical failure mode is staleness rather than hallucination.
References
- [1]Vladimir Pitenin, "Invisible to the Machine: Auditing AI Restaurant, Café, and Bar Recommendation Against a Complete Market Census", arXiv 2026
- [2]Baig, Gillani & Ali, "Whose hotel does the AI recommend? An algorithm audit of reputation signals in LLM-assisted hotel selection", arXiv 2026
- [3]Jack, Lehman, Maloney & Xu, "Prominence-Stratified Failure Modes in Retrieval-Augmented Commercial Recommendation: A 37,000-Run Audit", arXiv 2026
- [4]Jack, Lehman, Maloney & Xu, "Paraphrase Brittleness in Production Retrieval-Augmented Commercial Recommendation", arXiv 2026
Summary
- The study enumerated all 4,776 restaurants, cafes, and bars in Canggu and Ubud, Bali, then ran 96 queries through four AI systems 2,208 times over seven days, measuring for the first time against a full market denominator how many businesses are missing from recommendations.
- 85.6% were never recommended, and 72.6% of established venues with 50+ reviews were missing too. The author treats these numbers as floors.
- The entry threshold, making the recommendation list, was set by an own website (OR 1.92), review volume (1.64), listed prices (1.54), and web mentions (1.44); star rating was null (0.89).
- At the rank threshold, which decides who comes first among recommended venues, rating became significant (1.17) and web mentions became null. The two thresholds have different sets of predictors.
- The failure mode was recommending closed venues (14 venues, 93 times) far more than inventing them (0.08%), and repeated runs of the same question shifted substantially.
Check this topic against your own brand
TRAIL Search measures how ChatGPT and Perplexity answer your customers' questions and finds and fixes where the brand is missing, turning this post into a diagnosis. Start with 10 questions, no card required.
More posts
Where Does AI Get Brand Information? 85.7% Is Third-Party
Where does AI get brand information? Of 167,551 citations for 128 European brands, 85.7% were third-party sites. The top source shifts by language.
Adding a diversity reward to query fan-out: Google's R4T
R4T trains query fan-out on groundedness, diversity, and alignment rewards, then distills it into a small diffusion model. Is that diversity right for search?

Which of two pages will AI cite? The 4 gatekeepers
What does content need to get cited over a competitor in generative search? A 252K-run study finds four gatekeepers, and ChatGPT and Gemini differ.
Keep reading on this topic
- A survey of 45 GEO papers: what holds up and what doesn'tA survey of 45 GEO papers: four research shifts in three years, nine stages of AI visibility, why content-only optimization cuts citations, and what reproduces.
- Which Brands Do AI Search Engines Mention? A BenchmarkA large-scale GEO benchmark of brand visibility across five AI engines: how size and awareness matter, how engines differ, and where citations come from.
- FeatGEO: Do keywords or structure earn AI citations?FeatGEO turns a page into features to optimize AI citation visibility and quality together, how it differs from word-level GEO, and its effect on human pages.
This post is part of the Papers category, which collects all 15 posts on the topic. See all posts in Papers